Don’t short semis …on leverage …during historical blowoff top…
Don’t short semis …on leverage …during historical blowoff top… byu/Lwl0905 inwallstreetbets Shorted before intel earnings rip h/t Lwl0905
Independent thinking for complex markets and current events
Don’t short semis …on leverage …during historical blowoff top… byu/Lwl0905 inwallstreetbets Shorted before intel earnings rip h/t Lwl0905
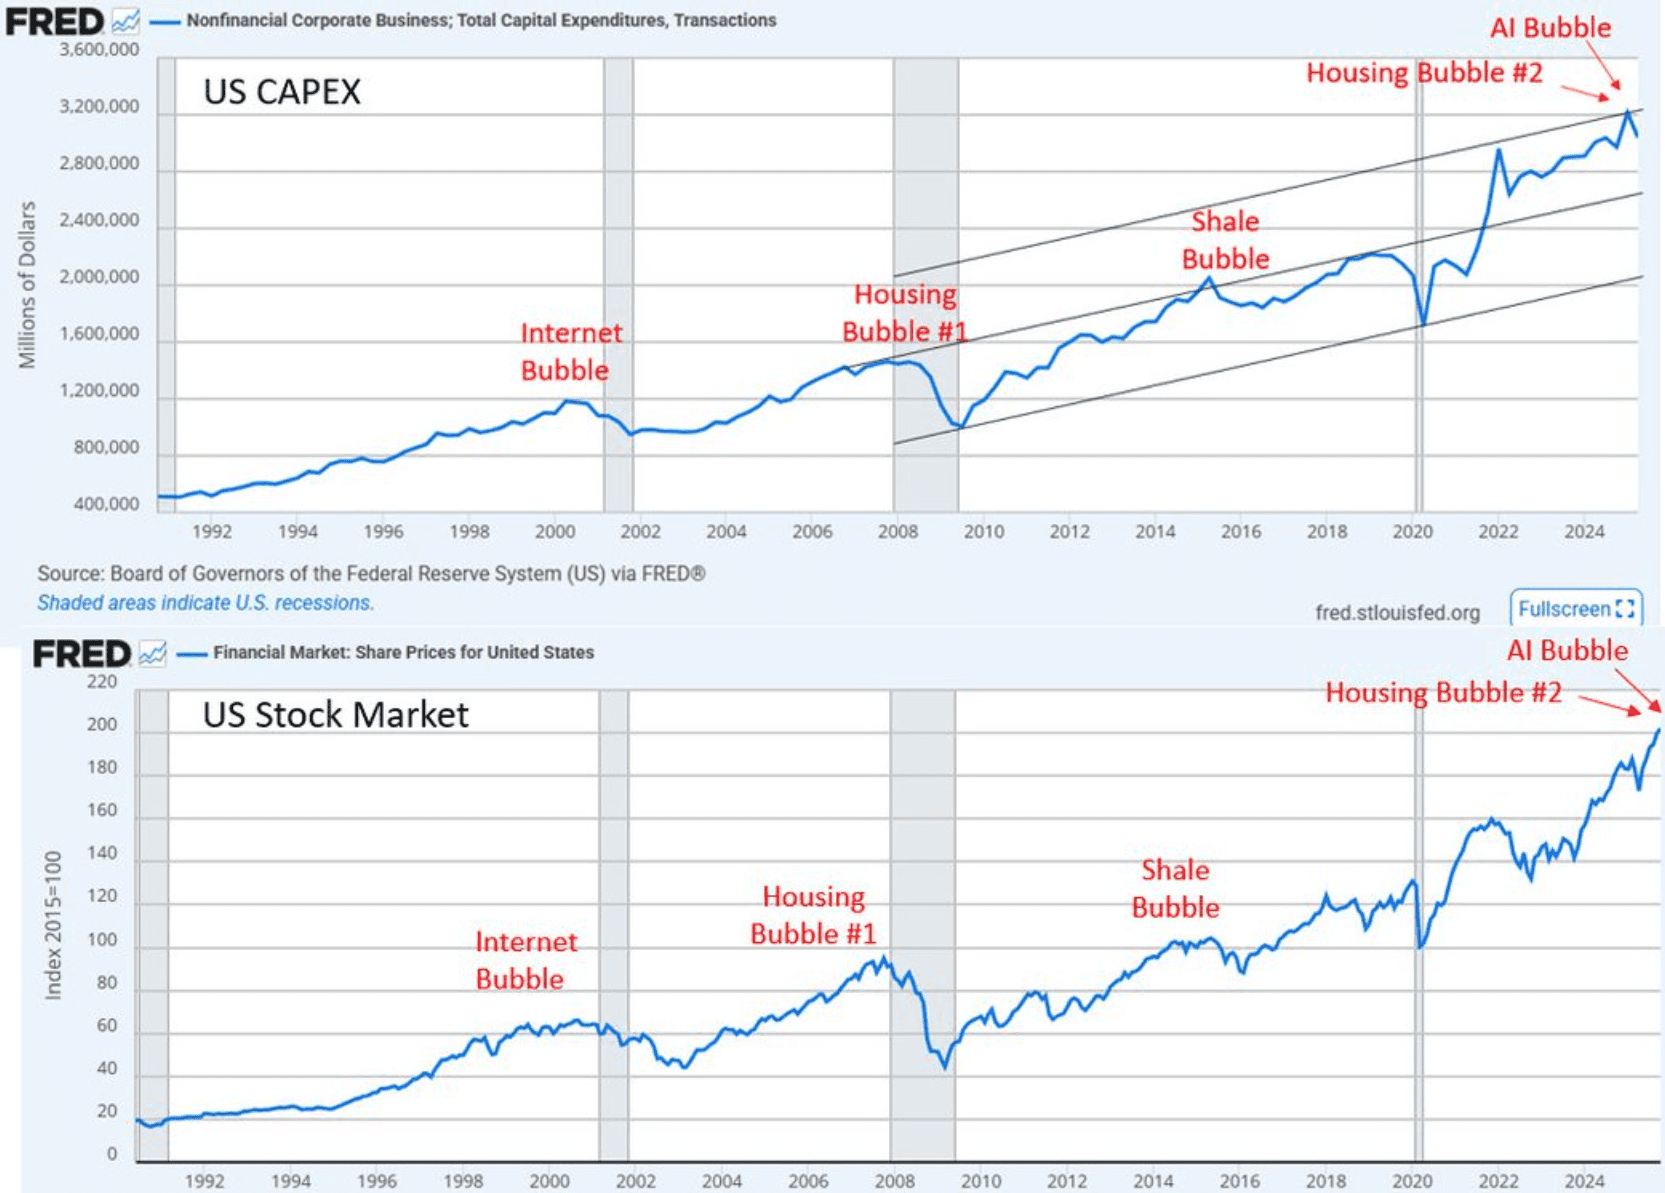
When CAPEX history meets nosebleed valuations, the only direction for risk is down. “What lower short term rates have done is keep stock prices elevated & valuations stretched. That distortion shows up clearly in the data. The $SPY currently trades near ~25× forward earnings, well above its long-term median closer to ~16×” FULL ANALYSIS BELOW! …
When the Fed cuts rates while $SPY is trading near all-time highs (within 1%), the market usually falls sharply 2–3 months later. That aligns closely with our model’s prediction of a serious correction beginning in February 2026. Every time rate cuts begin near market peaks, the aftermath has been very bad. Historically, the pattern is …
Trey Gowdy is absolutely wrong. Shame and historical judgment are not fitting penalties for those who perpetrated the Russian collusion hoax. Only indictments and life sentences. No quarter for these swine! pic.twitter.com/sbA9yNV2d2 — Eric Matheny 🎙️ (@ericmmatheny) August 1, 2025
Home prices in the USA have increased from $25,800 in 1971 to $419,200 in 2024. Over this same period of time household income has also increased but at a much slower rate. For this reason when looking at historical home affordability a common ratio is the home price to income ratio. This ratio allows us …

A historical winter storm brought rare heavy snow to the gulf coast. Houston started things off late Monday/early Tuesday with mixed precipitation causing slick roads. Heavier snow began moving into the Beaumont to Lake Charles area a few hours later. Numerous accidents occurred with roads becoming quite treacherous. Heavy snow accumulation occurred even right up …
Here's one of my objective measures to value #gold; it’s undervalued. Like 1974 & 1980, gold won’t be overvalued until red line crosses blue line, which is presently $10,902 (assumes #CentralBanks have in their vaults the gold they claim to own; so fair value probably higher). pic.twitter.com/1HCgJmL2ni — James Turk (@FGMR) January 14, 2025 Fair …
Biden didn’t just pardon his son for his convictions on tax and gun charges, but for any “offenses against the United States which he has committed or may have committed or taken part in during the period from January 1, 2014, through December 1, 2024.” That’s a nearly 11-year period during which any federal crime …
https://twitter.com/Thompsonklay/status/1849761622182559897

A machine gun possession charge was dismissed by a district court in Kansas yesterday on Second Amendment grounds. The court found that machine guns are clearly bearable arms, and in this case at least, the government failed to show a historical tradition to justify their ban. pic.twitter.com/tCou5USFmE — Kostas Moros (@MorosKostas) August 22, 2024 Lots …
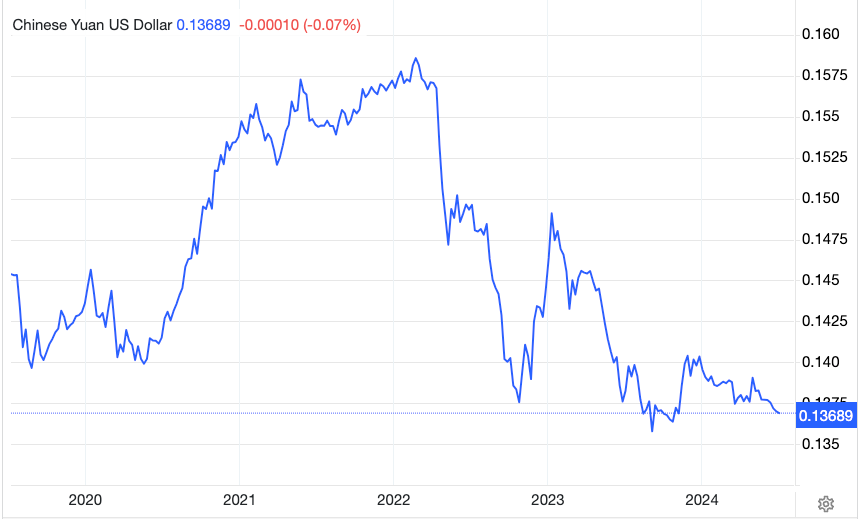
On July 1, 2024, the People’s Bank of China (PBOC) made a groundbreaking announcement: it would undertake bond borrowing operations with select primary dealers to ensure the stability of the bond market. This unprecedented move has already ignited widespread discussion in China, particularly concerning its potential long-term effects on the renminbi exchange rate and the broader …
Central banks were recently asked why they buy gold. Their responses were not surprising but reassuring. Almost 50% of respondents cited three main reasons: No default risk. Strong performance during crises. Historical significance. In reality, no other asset matches gold’s… pic.twitter.com/G982GBnL0q — Otavio (Tavi) Costa (@TaviCosta) June 22, 2024 Central banks have indeed been increasing …
The Nasdaq 100 continues to notch record high after record high. Many of its stocks are not only lagging, but they're falling to monthly, quarterly, or even yearly lows and below their 10-, 50-, and 200-day moving averages. This is not normal. In fact, it's never happened before… pic.twitter.com/gopsw8WUJn — SentimenTrader (@sentimentrader) June 17, 2024 …
You couldn’t possibly be referring to them simply not admitting everything was on fire… h/t Calm_Improvement659
A bill that requires all Oklahoma public and charter schools to teach cursive writing to students in third through fifth grades has been signed into law. The Oklahoma House of Representatives said Gov. Kevin Stitt signed the bill, House Bill 3727, into law on Tuesday. Oklahoma House Representative Jason Lowe, D-Oklahoma City, created the bill with Senate author …
Chart for future history books pic.twitter.com/uHb3DSTgRX — Michael A. Arouet (@MichaelAArouet) March 8, 2024 In the intricate dance of financial markets, certain patterns emerge as echoes of the past, and the current landscape seems to be no exception. The prevailing narrative of economic optimism faces scrutiny as key indicators suggest a departure from the rosy …
Indeed, that's a key point. Additionally, the coming commodity super cycle is going to be driven by the supply crunch of essential commodities such as copper and silver. Contributing to their growing scarcity… pic.twitter.com/Kc06kclh6G — Phoenix Capital (@PhoenixCapitalH) December 23, 2023 Equities are expensive. Commodities are generationally cheap Do with this as you wish. pic.twitter.com/SpHmqL6eKk …
🚨 BREAKING: Joe Biden raises the possibility of “American troops fighting Russian troops”… pic.twitter.com/6uKclxmDE4 — Benny Johnson (@bennyjohnson) December 6, 2023 Biden probably thinks this will help him get reelected because traditionally America rallies behind a U.S. President. Never mind the fact that if Russia starts killing a bunch of American troops it could easily …

The prospect of the Fed concluding its tightening raises questions about an imminent stock market boom, yet historical trends offer no definitive answers. Analyzing the S&P 500’s performance after past Fed peaks reveals a mixed picture, with the market experiencing both falls and rallies. The outcome hinges on the potential occurrence of a recession and …
The market’s recovery, reminiscent of historical patterns like the Nifty Fifty era, raises concerns about the sustainability of the current narrow leadership dominated by a select few mega-cap stocks. This market recovery has been unusual, with very narrow leadership, but it's not the first time. The early 1970s and late 1990s both were dominated by …

by Chris Black The labeling of a Roman emperor as transgender by a woke British museum has ignited a fierce debate among historians. While the museum suggests a transgender identity, scholars argue that the Romans lacked the concept of “trans” and used accusations of behaving “as a woman” as a severe insult. https://twitter.com/ChayaRaichik10/status/1727934944306213228 BBC: A …
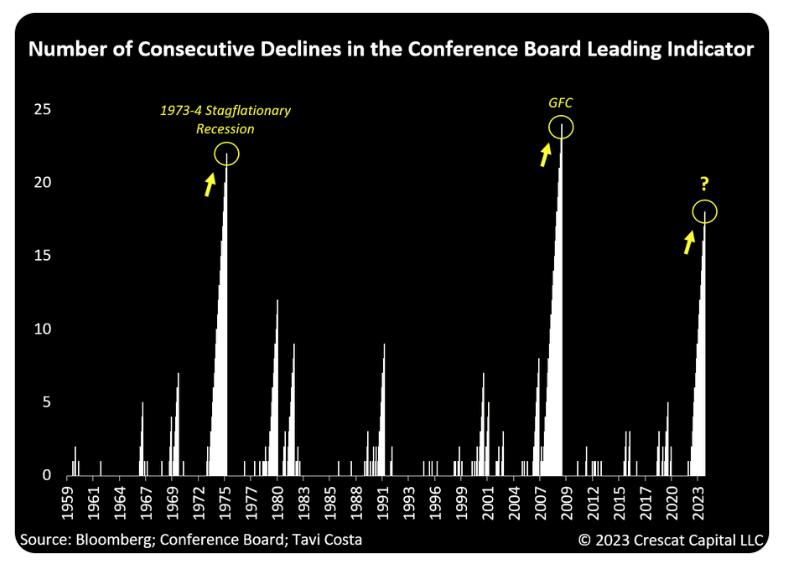
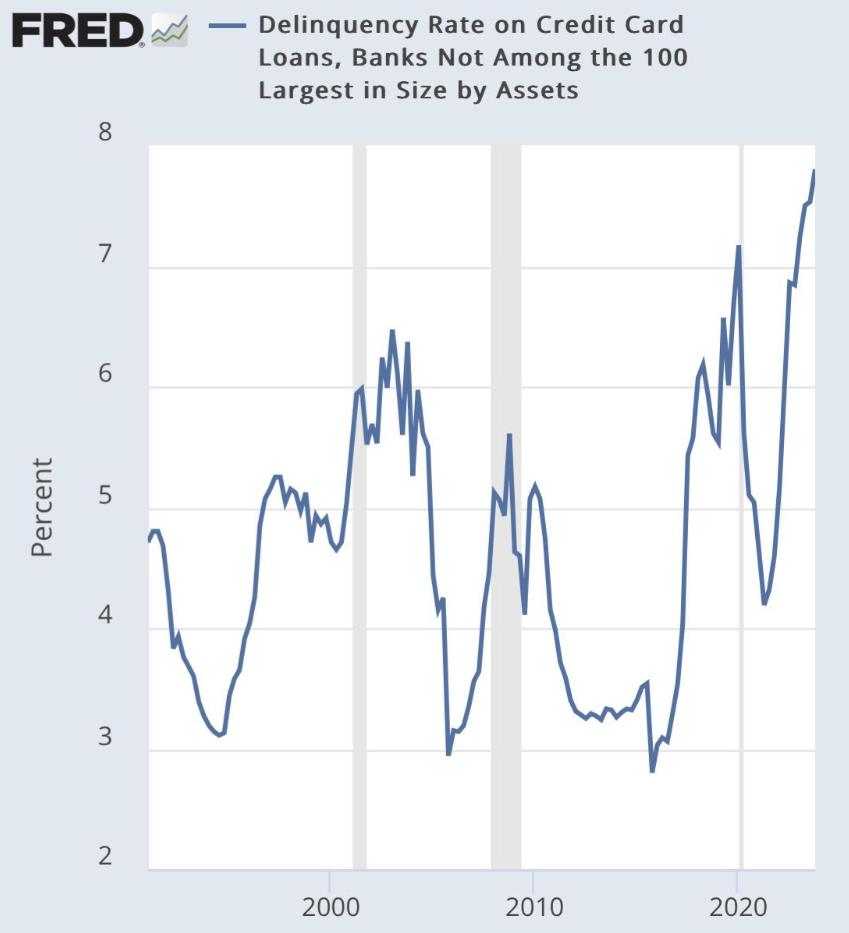
The sustained 18-month decline in the Conference Board Leading Indicator is a worrying trend reminiscent of historical economic crises, particularly in 1973-74 and during the Global Financial Crisis. The current -7.8% decrease aligns with significant economic downturns over the past six decades, indicating a potential hard landing. This, coupled with a high and rising loan …
The October Coincident Employment figures were influenced by the auto-strike, so we should reserve some judgment until those numbers are added back in November. 15 individual components are used across both indexes which reduces outsized distortions. — Eric Basmajian (@EPBResearch) November 16, 2023 https://twitter.com/MichaelAArouet/status/1725263899421712636 "It will probably start on a Friday" https://t.co/0EOYev1sC3 pic.twitter.com/9BBQamj3GK — Financelot …
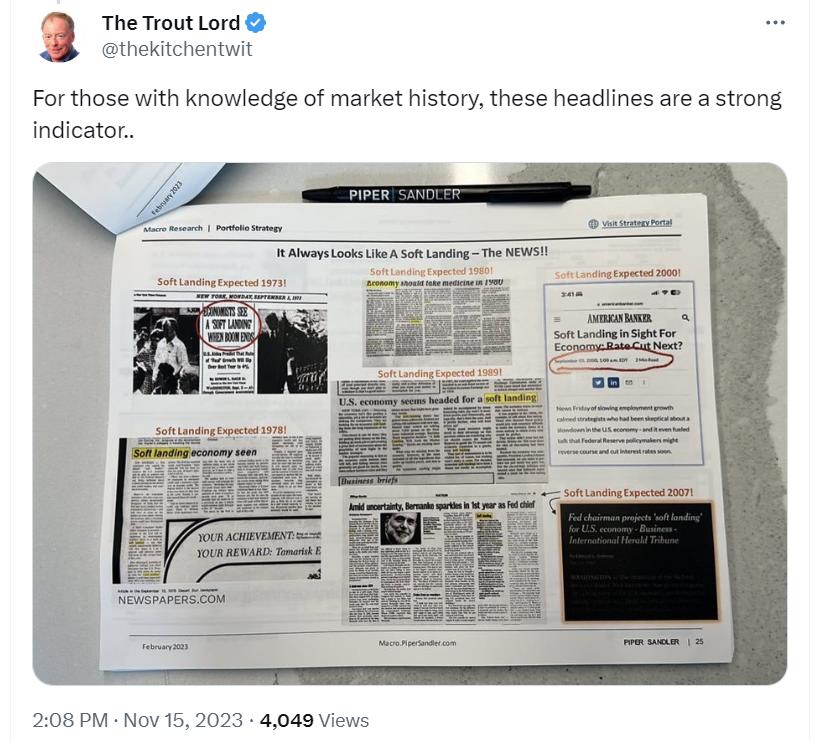
The crucial choice lies in deciding whether it occurs in the economy or manifests as inflation in the currency. For those with knowledge of market history, these headlines are a strong indicator.. pic.twitter.com/m2ZuHoptah — The Trout Lord (@thekitchentwit) November 15, 2023
In the last 120 years, when a country’s debt got really high, 98% of them ended up not being able to pay it back. Ken Griffin says the government can avoid this by printing more money, but it would mess up the economy really bad. A simple solution could be for Congress to spend less, …

by confoundedinterest17 Bidenomics strikes … again. No, not his inane ramblings about Hamas being “the other team” or that Hamas has to learn to shoot straight. But his policies freezing effects on the economy. Like housing. Existing-home sales faded in September, according to the National Association of REALTORS®. Among the four major U.S. regions, sales rose …
The Canadian birth rate has dropped to historical lows — a trend that is likely connected to the crushing price of housing for young people looking to start families, per the National Post. — unusual_whales (@unusual_whales) October 13, 2023
“According to Reuters, the US currently has just 17 days of supply left in the Strategic Petroleum Reserves (SPR). This is roughly half the historical average of ~33 days dating back to 1990. Meanwhile, oil prices are still almost 30% above the target price the US set to refill them. Tomorrow, an OPEC meeting kicks …