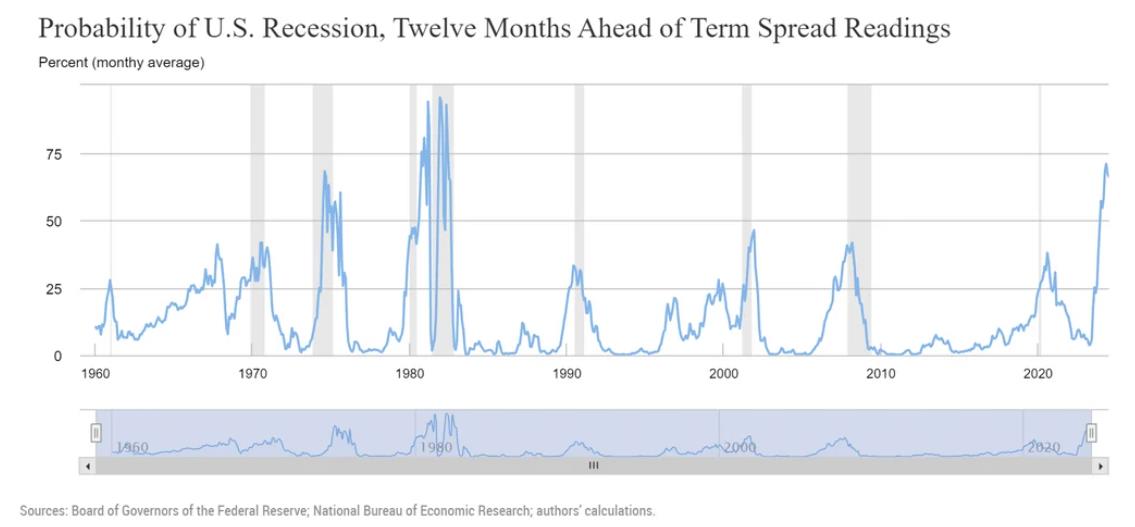
The yield curve guy is back – chart of US recession probability

Source: https://www.newyorkfed.org/research/capital_markets/ycfaq.html#/overview

The yield curve as a leading indicator uses the 10y-3mo value to predict the probability of recession. July report came out a couple days ago and May ’24 is higher than any time in the last 40 years at 70.85%. This is not the fed’s official prediction but is a tool they build and publish.

h/t marketsimulator

Uh-oh! It looks like you're using an ad blocker.

Our website relies on ads and the generous support of readers like you to keep delivering free, high-quality content. Right now, we are facing serious funding challenges and we need your help more than ever. Disable your ad blocker and this message will vanish. You can also sign up for a membership to enjoy an ad-free experience while supporting our work: https://citizenwatchreport.com/plans/subscriptions/ Your support helps us stay independent, continue our work, and keep content free for everyone. We truly appreciate your understanding and thank you for standing with us.