S&P 500 hits new all-time high as investors shrug off Iran war oil price spike
The S&P 500 hit a new all-time high Wednesday, a remarkable turnaround for the broad-based stock index while the war with Iran continues and rising energy costs threaten global growth prospects.
The S&P 500 closed higher by 0.8% pushing the benchmark past its previous record high of 7,002.28, which it had notched Jan. 28. The index closed at 7,022.95.
U.S. equity markets have been on a roller coaster since the start of the year. After its January high, the S&P 500 plunged 9.8% to a low of 6,316.91 on March 30, driven by the U.S.-Israel war on Iran and the soaring price of oil.
But in the two weeks since, markets appear to have adjusted to the constant uncertainty of the war.
“As far as the stock market is concerned, the war is over until further notice,” Ed Yardeni, president of Yardeni Research, said.
“It has also been another momentum-led rebound, similar to last year’s explosive rally that started on April 9, when President Donald Trump postponed his Liberation Day tariffs,” Yardeni said.
https://www.nbcnews.com/business/markets/sp-500-hits-new-high-iran-war-rcna331900
🚨 SOMETHING VERY STRANGE IS HAPPENING
S&P 500 just hit a new all-time high of $7,000.
Right in the middle of the worst energy crisis in decades.
But almost nobody is talking about the real reason.… pic.twitter.com/0vfZsKzICF
— MARMOT (@Web3Marmot) April 15, 2026
I can’t recall a day when the $SPX made a new all-time high with only 11 of its components making new 52-week highs.
— Frank Cappelleri (@FrankCappelleri) April 15, 2026
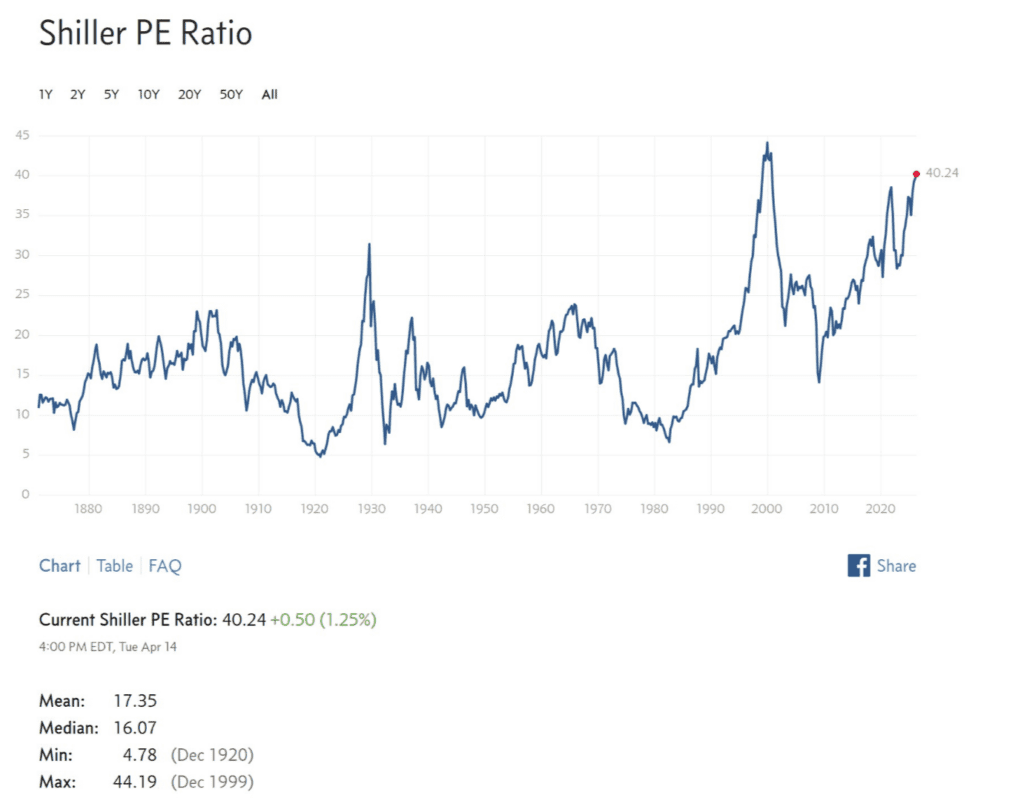
Stock are cheap based on which metric ? pic.twitter.com/QLw276oQad
— Data Driven Stocks (@stockdatamarket) April 16, 2026
Since 1928, this is the first time the S&P has made new all-time highs in 11 days or fewer after falling 5-10%.
— Bespoke (@bespokeinvest) April 15, 2026
They’re going to recreate the 1929 Dow Jones chart & crash.
My thoughts as to where we are currently. If we rally past the April 17th New Moon, we can potentially rally until mid May, on the hopes that interest rate cuts from Kevin Warsh are coming, which falls on the day after… pic.twitter.com/f8doZ66tK9
— MrBujok (@BujokMr) April 15, 2026
Markets are training people to think crashes don’t happen anymore.
That’s how the riskiest setups take shape.
In 1929, investors thought prosperity would last for good. During the dot-com bubble, they thought technology had rewritten the old rules. Today, the story has changed, but the pattern hasn’t. Every shock feels brief. Every dip gets bought. Liquidity is expected to show up before any real damage sets in.
After a while, that repetition changes how people act.
They stop taking downside seriously. They stop hedging. They start brushing off volatility like it means nothing, instead of seeing it for what it is, a warning sign.
The market isn’t getting rid of crash risk. It’s dulling fear and teaching participants to look past it.
That’s why the next real break, whenever it comes, hits harder than most expect.
Markets are training people to think crashes don’t happen anymore.
That’s how the riskiest setups take shape.
In 1929, investors thought prosperity would last for good. During the dot-com bubble, they thought technology had rewritten the old rules. Today, the story has changed,… pic.twitter.com/oO1iHchwLs
— Macro Liquidity by Sunil Reddy (@Macrobysunil) April 15, 2026
I would never have expected such a V shaped recovery under these uncertain macro conditions. pic.twitter.com/OOqO6I24WN
— Market Watcher (@watchingmarkets) April 15, 2026
This is another factor driving the melt-up:
Deutsche Bank has been circulating a chart that they claim shows the typical market impact of “geopolitical events” since 1939.
https://finance.yahoo.com/markets/stocks/articles/rocky-start-classic-geopolitical-playbook-133900729.html
Basically what they are saying is that ALL geopolitical events follow the “average” market path.
Which is statistical data mining bull shit.
The event this oil shock most resembles is the 1974 oil shock caused when OPEC embargoed oil to the U.S. and other countries, for assisting Israel during the 1973 Yom Kippur war.
In this chart you will see that the 1974 oil shock led to the worst bear market of the 1970s. Peak to trough the Dow lost -45% of its value:
https://en.wikipedia.org/wiki/1973%E2%80%931974_stock_market_crash
Too bad it’s not 1974. People are A LOT dumber now than they were back then.
https://x.com/SuburbanDrone/status/2044457084276584513
S&P 500 relative to M2 Money Supply 🚨 Dot Com Bubble vs. Now 😱👀 pic.twitter.com/ZHXj9cy0tF
— Barchart (@Barchart) April 15, 2026
BREAKING: US call option volumes have surged to 47 million contracts per day, the 2nd-highest reading this year.
Call volume has surged +75% since the beginning of the month.
At the same time, put option volume has declined -15%, to 32 million contracts per day.
Yesterday,… pic.twitter.com/7sttFDsepA
— The Kobeissi Letter (@KobeissiLetter) April 15, 2026
SPX hits an all time today.
Make it make sense
Most retarded market in history 🤦♂️ pic.twitter.com/ao1l8I7zDg
— QE Infinity (@StealthQE4) April 15, 2026
People think the oil crisis is over and are bidding up stocks lol.
Laughable https://t.co/83emwH8Kav
— QE Infinity (@StealthQE4) April 15, 2026
🚨 INSIDERS ARE STILL SELLING
Only one buy out of the top 60 insider transactions.
It makes you wonder who’s buying and providing them with exit liquidity. pic.twitter.com/HVBhL0Gi7n
— NoLimit (@NoLimitGains) April 15, 2026
🚨The ceasefire may just be the calm before a massive storm. ⚠️
I have confirmed from two separate military sources that the U.S. is preparing for a "massive, huge, concentrated bombing campaign" the moment the current lull ends. Despite talks of a negotiated settlement, physical… pic.twitter.com/b08CsFIfp1— Daniel Davis Deep Dive (@DanielLDavis1) April 15, 2026
The "Buy Now, Pay Later" crisis:
47% of Buy Now, Pay Later (BNPL) users were late in paying their BNPL loans over the last year.
This percentage has risen +6 points from 2025 levels and +13 points over the last 2 years.
High-income borrowers, young adults, men, and parents of… pic.twitter.com/zryot0CT9y
— The Kobeissi Letter (@KobeissiLetter) April 15, 2026
Investors believing the Stock Market is overvalued plunges to the lowest level in more than 7 years 🚨🚨 pic.twitter.com/fZ0zkvQfk7
— Barchart (@Barchart) April 15, 2026
Options Traders are the most bullish on Stock Indexes since 2019 after the Index put/call ratio plunged to 0.70 yesterday 👻😱 pic.twitter.com/tlEClwONgL
— Barchart (@Barchart) April 15, 2026