As I keep telling you, it IS possible to time the market. The key is to put in the work to do so.
For me, one of the best means of predicting stock market moves is to focus on “market leading” indicators, or assets that typically lead stocks to the upside and the downside during market turns.
One of my favorite such indicators is high yield credit, or junk bonds.
Bonds/ credit are senior to stockholders. If a company goes bust and needs to liquidate its assets, bond/ credit holders will be paid out long before stockholders see a dime. And generally speaking, bond investing is more sophisticated than stock investing largely due to bonds’ greater sensitivity to Fed policy, the economy, and more.
As a result of this, credit, particularly high yield credit, or credit for companies that are at a greater risk of going bust, typically leads stocks when it comes to pricing future risk on or risk off moves.
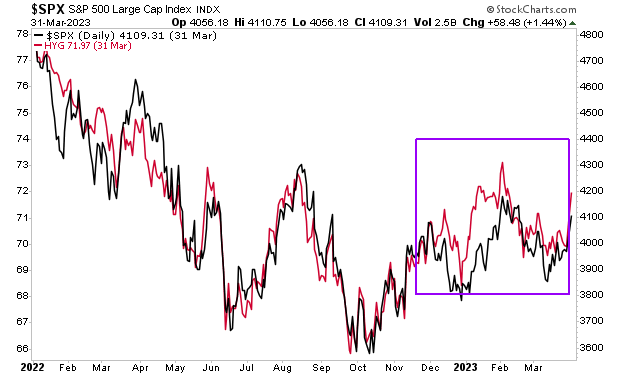
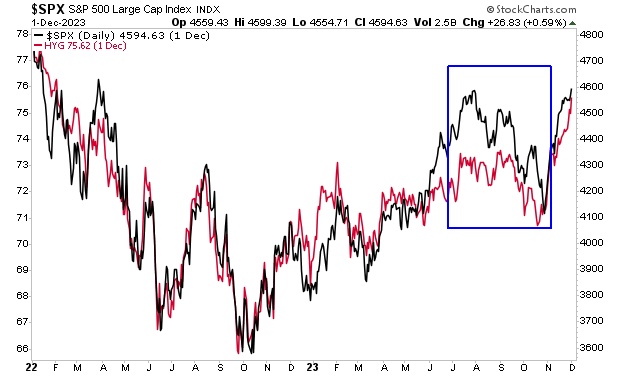
You can see this clearly in the following charts which depict the High Yield Corporate Bond ETF (red line) and the S&P 500 (black line). Sometimes the two assets move in tandem, but other times, credit leads stocks clearly to the point that you can accurately predict the next market move for stocks.
The first chart concerns the risk on move in assets that occurred from late 2022/ early 2023. At that time, HYG lead the market to the upside, rallying aggressively even when stocks would dip for a day or two. I’ve illustrated this with a purple rectangle below. Throughout that time period, the ongoing strength in HYG was a reliable indicator that the stock market would continue to rally.
Another example concerns the risk off move in assets that occurred from July 2023 through November 2023. During that period, high yield credit failed to confirm any rally in stocks, with the red line (credit) rolling over quickly even when the black line (stocks) bounced aggressively. I’ve illustrated this with a blue rectangle in the chart below.
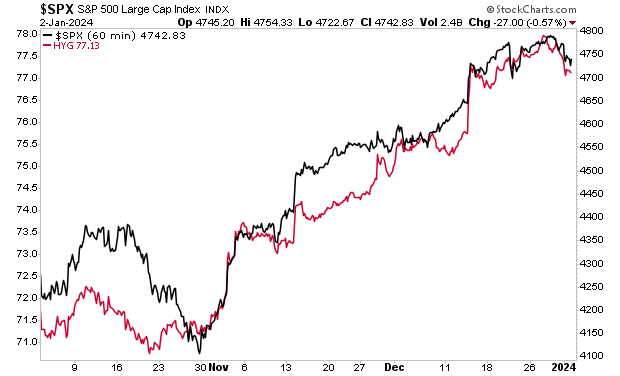
So, what is high yield credit telling us about the future of the stock market today?
HYG is leading stocks to the downside, though it is doing so in a very controlled manner. Right now, HYG is suggesting that the S&P 500 will drop to 4,700 or so. Obviously this can change as things develop, but for now, HYG is telling us that any stock pullback should be relatively shallow.