This is the new modified “Fed Net Liquidity” chart as per Michael Howell.

Sharing is Caring!

by DesmondMilesDant

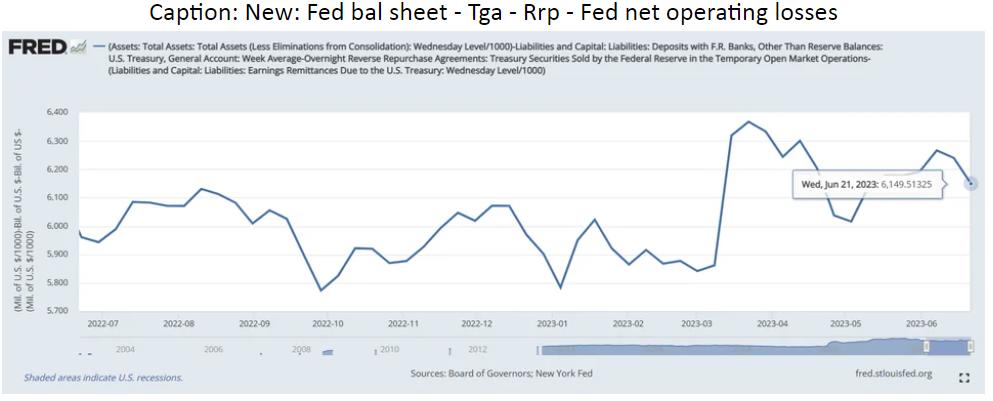
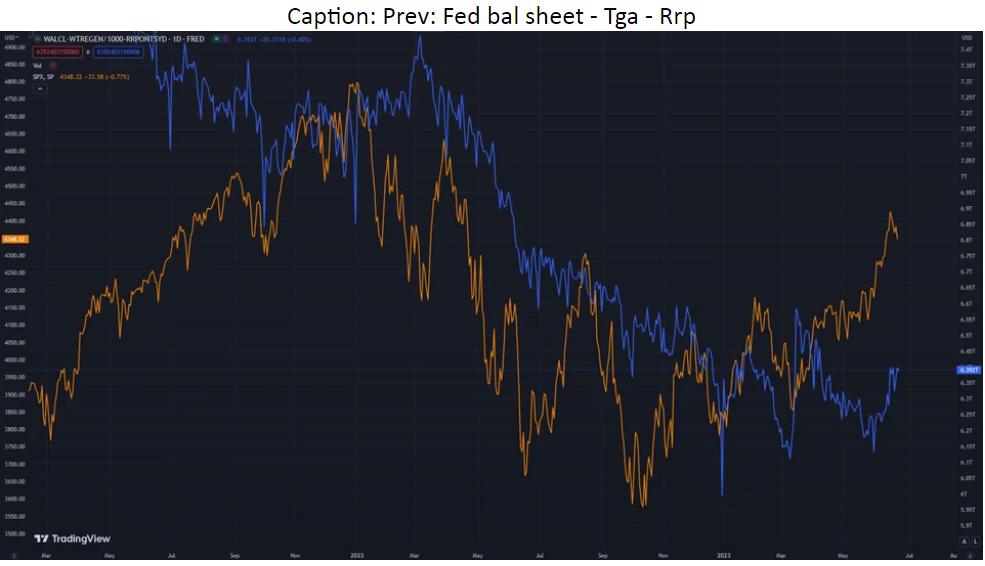
Well in the first as written in the flash screen: Fed bal sheet – Tga – Rrp – Fed net operating losses. As for the second chart it’s the old measure: Fed bal sheet – Tga – Rrp.

P.s. Not mark to mark but when paying up more in interest than receiving in bonds and notes.

See also  Consumer revolving credit in the US just fell off of a cliff! Fed repeats 2007 error: Fighting inflation while recession looms in 2025.

74 views