Unprecedented Tech Bubble: The Ratio of The Nasdaq To US Treasuries Soar Beyond Historic Levels; Stocks Are Also The Most Expensive Relative To Fixed Income In Over 20 Years
The Nasdaq’s return compared to US Treasuries is now at a record high, surpassing levels seen during previous bubbles and indicating a significant gap between equity and bond returns. So many unsustainable metrics out there right now. This also underscores the significant outperformance of the S&P 7 to the remainder of the index. Markets are …
READ MORE

‘This is as awkward as it sounds! The higher the debt-to-GDP ratio, the LOWER yields.’

The Bank of Japan, which holds a staggering 47% of ALL outstanding Japanese government #debt, has announced additional bond purchases to push #yields lower. This is as awkward as it sounds!The higher the debt-to-GDP ratio, the LOWER yields. pic.twitter.com/vAL0qWM87f — jeroen blokland (@jsblokland) October 2, 2023 When your perspective is #debt sustainability on a macro …

READ MORE

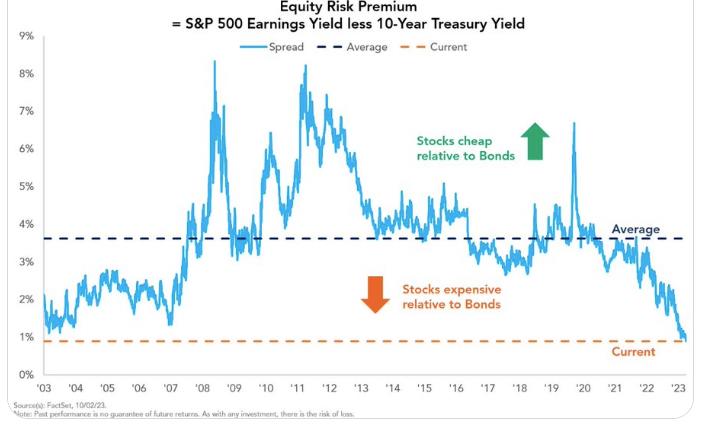
The equity risk premium (ERP) is at the lowest level since Pre-GFC; PEG ratio hit levels comparable to the Dot Com bubble

The equity risk premium (ERP) is at the lowest level since 2006 Indicating that stocks are very expensive relative to bonds pic.twitter.com/5tysUfs1Hy — Bravos Research (@bravosresearch) September 4, 2023 This ratio hit levels comparable to the Dot Com bubble We all know how it ended back then… pic.twitter.com/gb9Uzm7MPj — Bravos Research (@bravosresearch) September 5, 2023 …

READ MORE

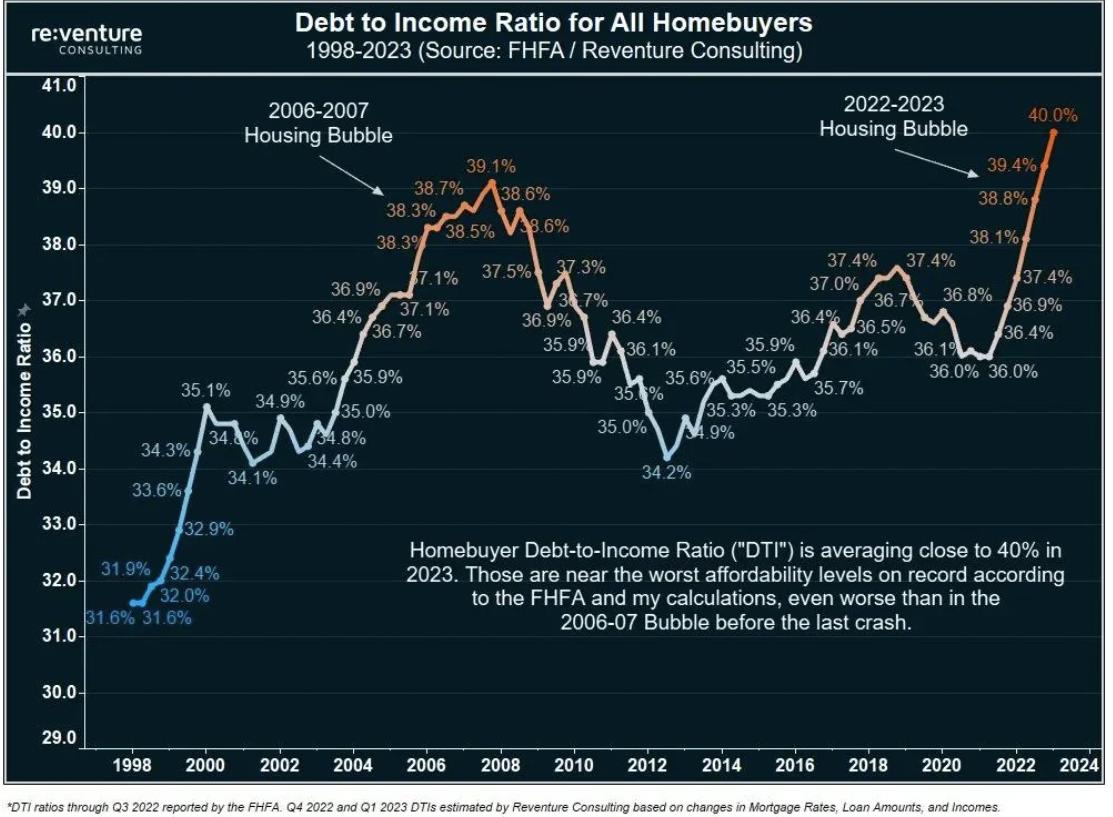
Home price-to-income ratio surpasses 2008 housing bubble. US median home price rises 38% since 2020, mortgage rates is up from 2.7% to 7.1%. They will kill houses?

https://t.co/HalIfhU6gE — Win Smart, CFA (@WinfieldSmart) July 19, 2023 The median home price in the U.S. is up ~38% since 2020. The average interest rate on a 30-year mortgage is up from 2.7% to 7.1% in ~2.5 years. The average mortgage payment on a 30-year mortgage is now $2,900. Could you afford to buy your …

READ MORE

Michal Stupavsky: ‘Buying NVIDIA shares today costs you 40 times historical annual revenues. That’s 40 years to get your money back, assuming $0 cost, 0% tax and a 100% payout ratio.’

Buying NVIDIA shares today costs you 40 times historical annual revenues. That's 40 years to get your money back, assuming $0 cost, 0% tax and a 100% payout ratio. Good luck! pic.twitter.com/tYUZc3Ito8 — Michal Stupavsky, CFA (@MichalStupavsky) June 20, 2023 Due to the fact that sell-side analysts' forward estimates are usually on the margin too …

READ MORE

PEG ratio measures what investors are willing to pay for a company’s earnings growth is now at historic levels last seen during the Dot Com bubble

PEG ratio measures what investors are willing to pay for a company's earnings growth — Bravos Research (@bravosresearch) June 19, 2023 Apple $AAPL made a new all-time high last week and is now just over 3.1% away from a $3 trillion market cap. pic.twitter.com/HgLmSUskG9 — Bespoke (@bespokeinvest) June 19, 2023 Current short interest on big …

READ MORE

Korea’s household debt-to-GDP ratio highest among 34 major economies

via koreatimes.co.kr: Korea’s household debt-to-gross domestic product (GDP) ratio was the highest among the world’s 34 major economies in the first three months of this year, data showed Monday. This has raised concerns that banks and other financial firms may face higher default rates amid higher interest rates and deepening economic warning signs. According to …

READ MORE

High levels of bullish sentiment and FOMO buying in tech. PEG ratio is now at levels last seen during the height of the Dot Com bubble

Investor surveys, put/call ratios, sentiment gauges and fund-manager positioning data all point to sky-high levels of bullish sentiment + a lot of FOMO buying in tech. It's pretty rare to see all of them sending the same message at once. pic.twitter.com/VnuCo8uQzd — Eric Jhonsa (@EricJhonsa) June 8, 2023 This ratio is now at levels last …

READ MORE

$qqq to $iwm ratio never higher… ‘Bye bye liquidity… right when everyone is max bullish and on vacation’…. ‘Getting out, there will be no one on the other side of the trade.’

Bye bye liquidity… right when everyone is max bullish and on vacation.pic.twitter.com/8Y0a7zk1WV https://t.co/FQUZXdc38m — Financelot (@FinanceLancelot) June 2, 2023 The chart of the week: S&P Tech with the ISEE call/put index:https://t.co/zlMsxl36fz Getting out, there will be no one on the other side of the trade. pic.twitter.com/rHyXwFz3oe — Mac10 (@SuburbanDrone) June 2, 2023 The $VIX hasn't …

READ MORE

Uh-oh! It looks like you're using an ad blocker.

Our website relies on ads and the generous support of readers like you to keep delivering free, high-quality content. Right now, we are facing serious funding challenges and we need your help more than ever. Disable your ad blocker and this message will vanish. You can also sign up for a membership to enjoy an ad-free experience while supporting our work: https://citizenwatchreport.com/plans/subscriptions/ Your support helps us stay independent, continue our work, and keep content free for everyone. We truly appreciate your understanding and thank you for standing with us.