Paul Tudor Jones warns US equity market is more dependent on stock prices than ever. Current equity valuation extremes exceed levels seen in 1929, 1987, and dot-com era of 2000

Paul Tudor Jones says the US is more dependent on equity prices than ever, and explains what a 35% correction would trigger in the economy: “We’re 252% of stock market cap to GDP. In 1929 we were 65%. In 1987 we got to ~85-90%. In 2000, 170%. If you think about the periodicity of significant …

READ MORE

1987 video of Trump wanting a war with Iran, stating we will get a war resulting from the middle east and should pursue the oil there. TODAY: Trump tells allies – “Go get your own oil”

That's it. I give up.. Donald Trump is a time traveler. 20/20 interview 1987. Wtf. pic.twitter.com/Q44GaCjIsI — Whiplash347 (@Whiplash437) March 30, 2026 2008… This aired in 2008. You don’t really know what you think you know. pic.twitter.com/KzB5jMYaPP — MrBanks💰 (@Mrbankstips) March 29, 2026 2010 El 16 de Febrero del 2010 Bill Ryan de Project Camelot …

READ MORE

Donald Trump Explained What He Wanted To Do To Iran During An Interview With Barbara Walters All The Way Back In 1987

by Michael Almost 40 years ago, a seemingly meaningless interview eerily foreshadowed what is happening in the Middle East right now. What I am about to share with you is absolutely amazing, because it shows that the threat that Iran poses was very much on Donald Trump’s mind even when he was a young man. …

READ MORE

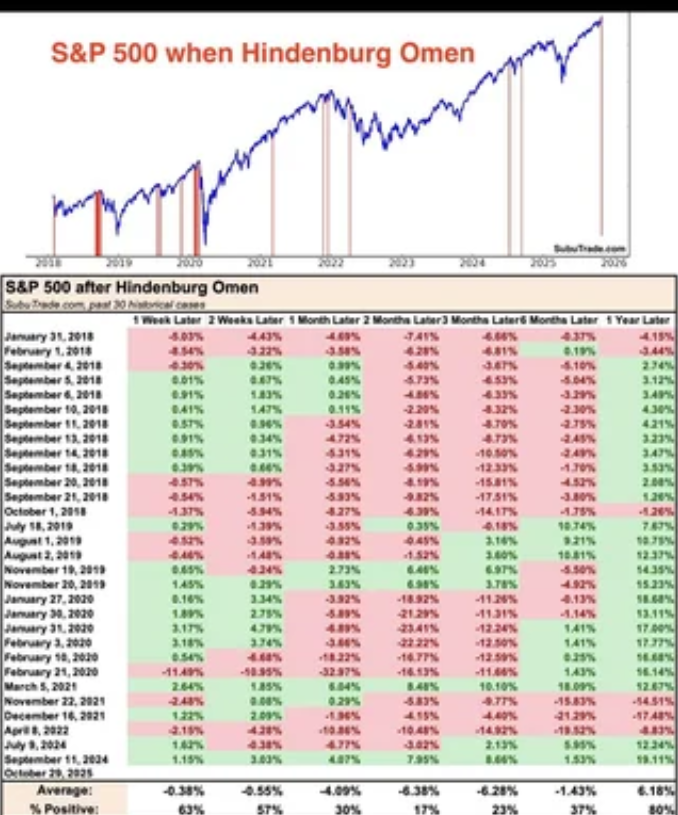
The Hindenburg Omen, an indicator that correctly detected the 1987 and 2008 stock market crashes, has been triggered!

via WSB: Explanation: “The Hindenburg Omen is a combination of technical signals that together forecast the likelihood of a stock market crash. The technical inputs are the 10 Week Simple Moving Average, New 52 week highs on the NYSE, New 52 Week lows on the NYSE, and the McClellan Oscillator. If, on the same day, …

READ MORE

This isn’t 2008. It’s something older, darker, more systemic. Maybe 1987. Maybe 1971. Maybe worse.

No one expecting 3% real growth in the US any time soon. pic.twitter.com/dAc96aKccl — Bob Elliott (@BobEUnlimited) May 24, 2025 The structural problem for the US is simple. Long-term GDP growth rate is falling. US Debt has been ballooning which has caused US Federal Interest Payments to skyrocket. Hence, the conundrum for the US Economy …

READ MORE

Dollar’s surge threatens Asia’s markets, mirroring 1980s Latin American crisis. S&P 500’s five-day decline mirrors 2022 and 1987 market crashes.

pic.twitter.com/BmgN8RzSM3 — Jack Krzewinski (@JackKrzewinski) January 2, 2025 "The relentless surge of the U.S. dollar is primed to cut a swath of carnage through Asia’s asset markets, leaving economic strain in its wake. The dollar wrecking ball similar wreaked havoc with Latam currencies in the 1980s… Historically, when the dollar flexes its muscle,… pic.twitter.com/y9Sc5afXM0 — …

READ MORE

Bitcoin’s 1987 moment is on approach. The entire industry is a massive ponzi scheme.

Future circuit breakers will be implemented, and comprehensive regulatory actions will begin when Bitcoin crashes 50k in under 24 hours. Bitcoin’s 1987 moment is on approach. Pin this post. Future circuit breakers will be implemented, and comprehensive regulatory actions will begin when Bitcoin crashes 50k in under 24 hours. Bitcoin's 1987 moment is on approach. …

READ MORE

The 12-month uptrend before 1987 mirrors today’s steep climb. Déjà vu, anyone?

The 1987 crash was largely influenced by the Fed’s rate hikes amid inflation concerns. It does feel like we’re seeing similar warning signs, rising inflation, interest rate hikes, and market volatility, though predicting an exact repeat is tricky. 1987 vs 2024 ✍️ Dow Jones: Let's analyze the lead-up to the 1987 crash vs. now. 12-month …

READ MORE

Yale University: 66.1% of retail investors and 56.03% of institutional investors believe the probability of a catastrophic stock market crash in the U. S., like that of October 28, 1929 or October 19, 1987, in the next six months is above 10%.

by Dismal-Jellyfish Wut mean?: On the flipside, this means 66.1% of retail investors and 56.03% of institutional investors believe the probability of a catastrophic stock market crash in the U. S., like that of October 28, 1929 or October 19, 1987, in the next six months is above 10%.    

The Last time Dow Jones Industrial Average had 13 green days in a row was the year 1987. ( Other years: 1970, 1929)

by DesmondMilesDant Why do those years sound so familiar… Oh right! 1929: The first crash of the Great Depression 1970: Dawn of Stagflation 1987: Black Monday Naw just has to be coincidence right? Right? Dow officially has the longest daily win streak since 1987. Ultra bullish. pic.twitter.com/3mLedordLU — Mac10 (@SuburbanDrone) July 26, 2023 13 straight …

READ MORE

Uh-oh! It looks like you're using an ad blocker.

Our website relies on ads and the generous support of readers like you to keep delivering free, high-quality content. Right now, we are facing serious funding challenges and we need your help more than ever. Disable your ad blocker and this message will vanish. You can also sign up for a membership to enjoy an ad-free experience while supporting our work: https://citizenwatchreport.com/plans/subscriptions/ Your support helps us stay independent, continue our work, and keep content free for everyone. We truly appreciate your understanding and thank you for standing with us.