A major liquidity indicator just turned negative for the first time since 2021.
That matters because this indicator is designed to track whether liquidity conditions are helping or hurting markets.
And right now, it is flashing a warning.
Then you look at the rest of the picture.
JPMorgan is warning about a possible $165 billion global equity selling wave from rebalancing flows.
At the same time, leveraged ETF assets have doubled in just two months.
So investors are taking on more risk while liquidity conditions are getting worse.
Interesting combination.
The Fed is not exactly giving investors easier money either.
The latest market pricing shows about an 87.7% chance of a rate hike this year.
Rate cut odds?
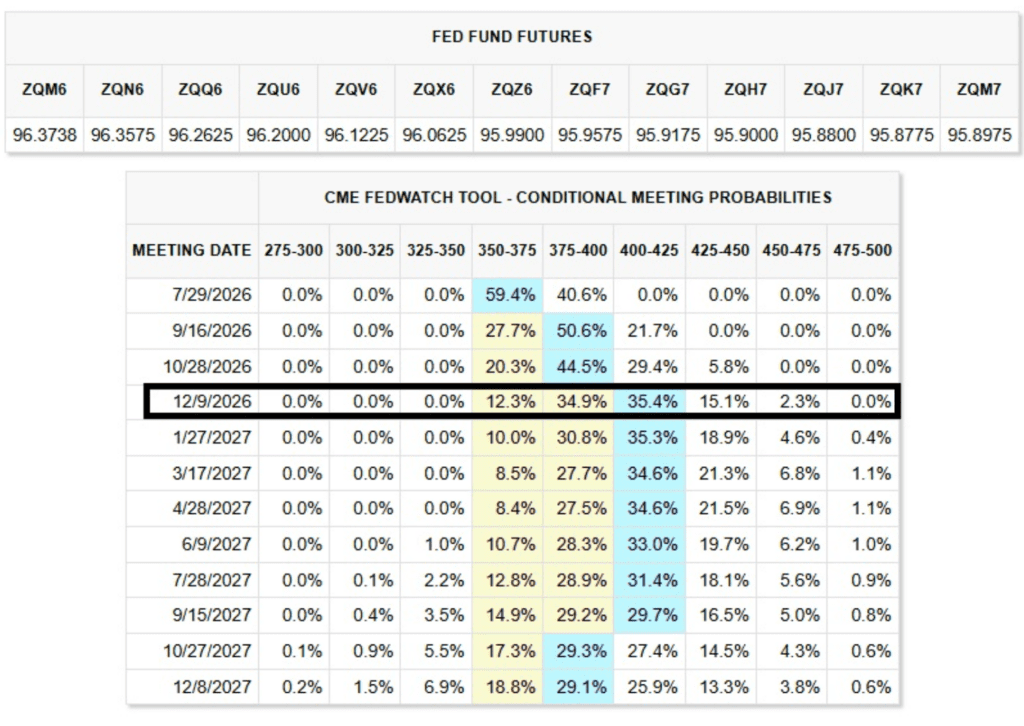
Yet risk appetite keeps climbing.
And then there is the market’s internal health.
The S&P 500 can be making new highs while many individual stocks struggle underneath.
That is why people are watching the six Hindenburg Signals in three weeks.
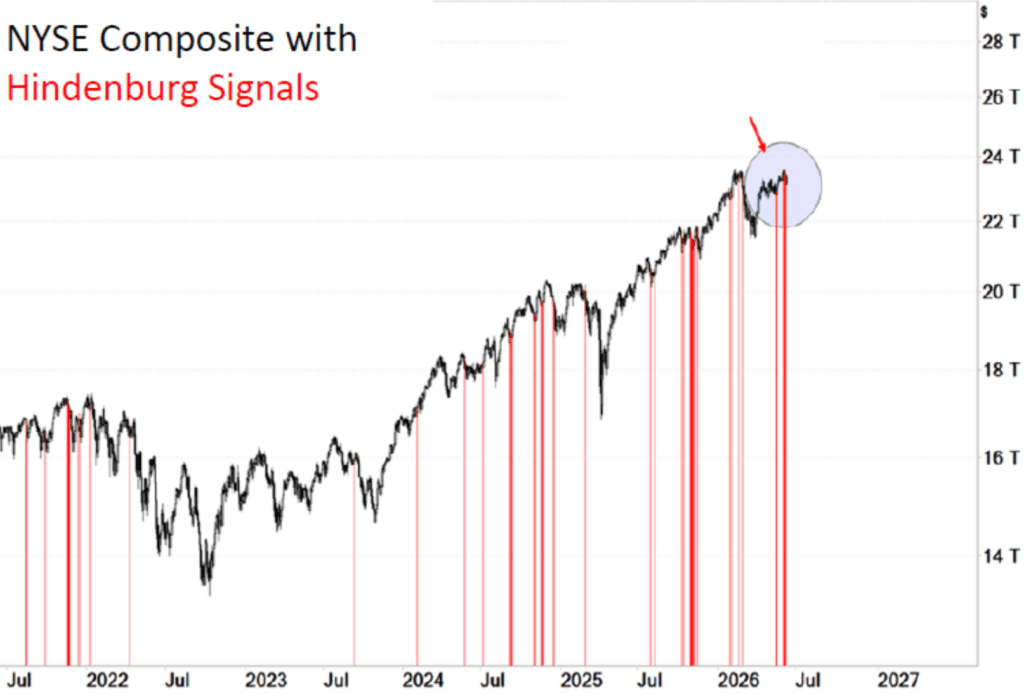
The name sounds ridiculous.
The idea is actually pretty simple:
The market is showing strength and weakness at the same time.
The index looks strong.
But parts underneath are starting to crack.
Now, does this mean the market crashes tomorrow?
No.
These indicators can be wrong.
A warning is not a prediction.
But the interesting part is the combination:
Liquidity turning negative.
Crowded trades.
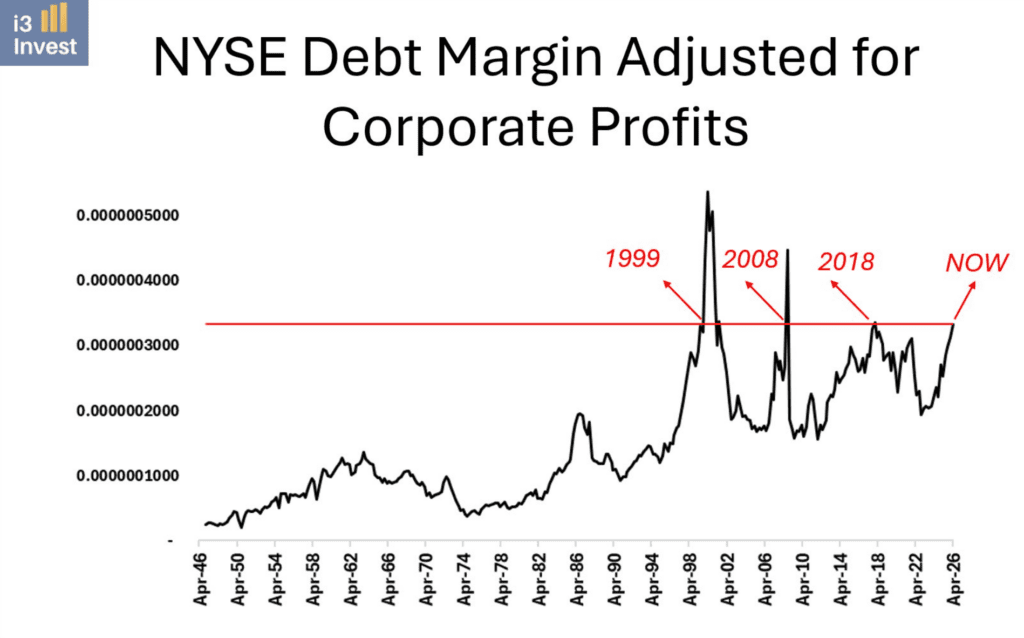
High valuations.
A Fed that is not promising cuts.
And investors still acting like nothing can go wrong.
Maybe the bulls are right.
Maybe earnings and AI keep pushing everything higher.
But when everyone is comfortable on the same side of the boat…
I usually start asking one question:
What happens if everyone tries to leave at the same time?