by davefairtex
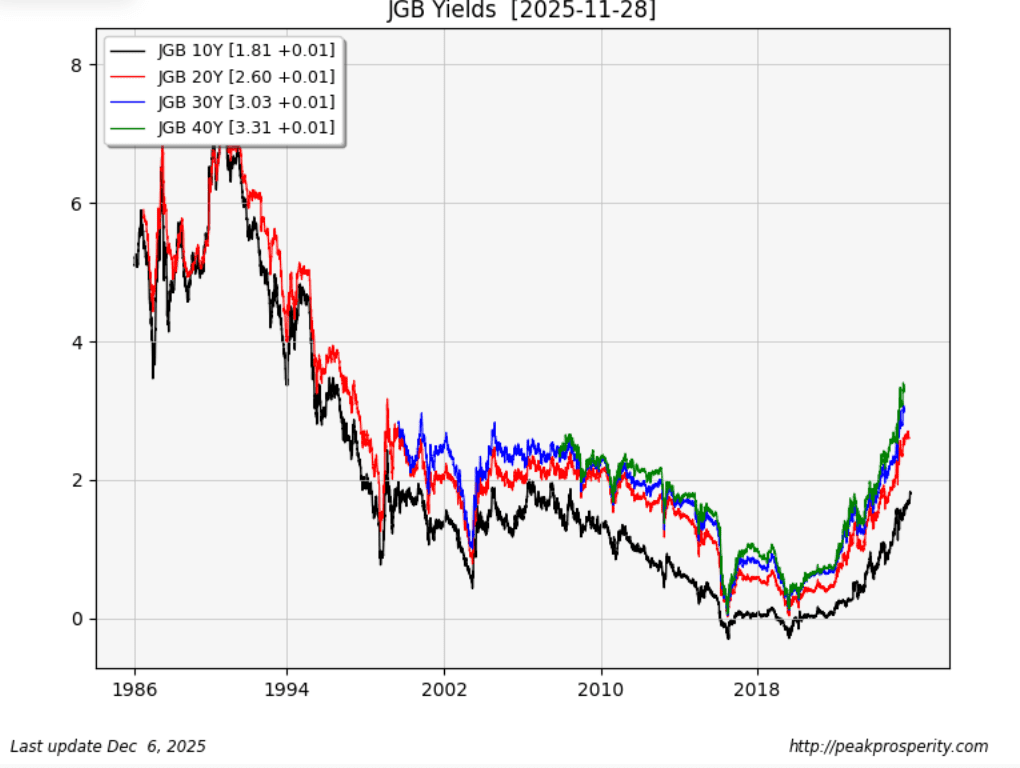
Here’s the data I got from the BOJ itself. It doesn’t update until end of month, so that JGB10Y should be 2.09, not 1.81. That’s bad, but not worst ever.
Why this matters: the JGB 30 (blue line) started being issued in 1999 (1999-09-02 2.84%). The 10 and 20 have been around since the 80s – so maybe they’re a better marker to see “highest in history” context. That doesn’t make “3.42%” good, but maybe it puts it in some context.
Armstrong’s rationale behind “flight from public to private assets” – if a company goes belly-up, you get a bankruptcy proceeding. If a government goes belly-up, you get nothing. So a panic out of (local) public assets goes into foreign assets (creating currency outflows), resources, and privately issued bonds and equity.
So maybe the big palladium/platinum moves are capital flight?