The bullish argument never changes.
“Don’t worry. There is still a mountain of cash waiting to buy stocks.”
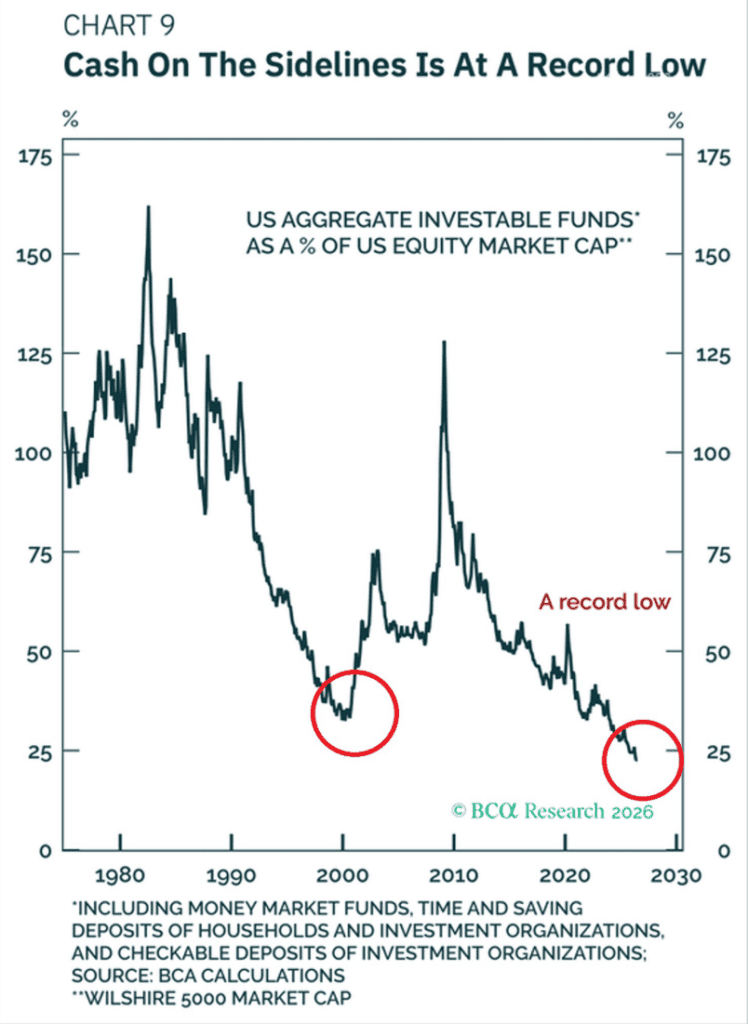
Then why is this chart at a record low?
U.S. investable funds, including money market funds, checking accounts, savings deposits, and time deposits, are now worth only about 23% of the Wilshire 5000.
That isn’t just low.
It’s the lowest reading on record.
Before the Dot Com crash, it was around 35%.
During the financial crisis, it shot up to roughly 130% because people dumped stocks and ran to cash.
That is what real dry powder looks like.
This isn’t.
Then I looked at something else.
The 30 year Treasury yield is back to 5.18%, the highest since April 2006.
The yield on the 30-year Treasury is 5.18%, its highest since April 2006. At that time, the U.S. national debt was $8.35 trillion. Now it’s $39.6 trillion, almost five times as large. The U.S. can’t afford these rates, let alone the much higher rates we'll soon be forced to pay.
— Peter Schiff (@PeterSchiff) July 23, 2026
Back then, the United States owed about $8.35 trillion.
Now it’s close to $39.6 trillion.
Same yield.
Very different country.
Higher yields don’t just make mortgages and loans more expensive.
They tighten financial conditions.
They raise the cost of borrowing across the economy.
They increase the government’s interest bill.
They also make investors think twice before chasing expensive stocks when they can earn more in safer assets.
That is liquidity leaving the system.
So now put the two charts next to each other.
There is less uncommitted cash relative to the size of the stock market.
At the same time, money is getting more expensive.
Those are not the conditions that fueled the last decade of easy gains.
People keep asking who will buy the next dip.
I think the better question is this.
If liquidity keeps getting tighter and most of the cash is already invested, where does the next wave of buying actually come from?