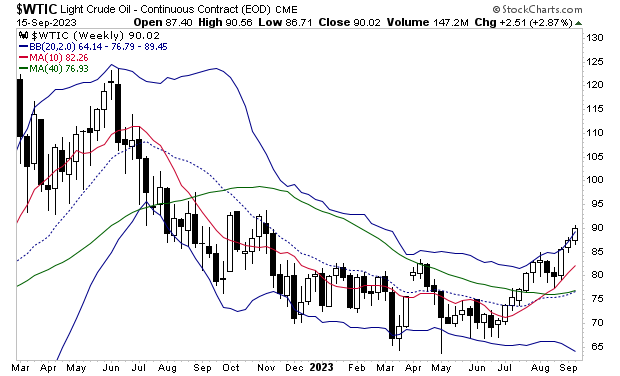
Inflation is back.
While mainstream economists prance around on television claiming that inflation has been defeated, the real data suggests otherwise.
It’s a well known “secret” on Wall Street that the official inflation measure, the Consumer Price Index, or CPI, is heavily massaged to UNDER-state inflation. However, even the CPI, with all of its gimmicks is showing inflation bottomed in June.
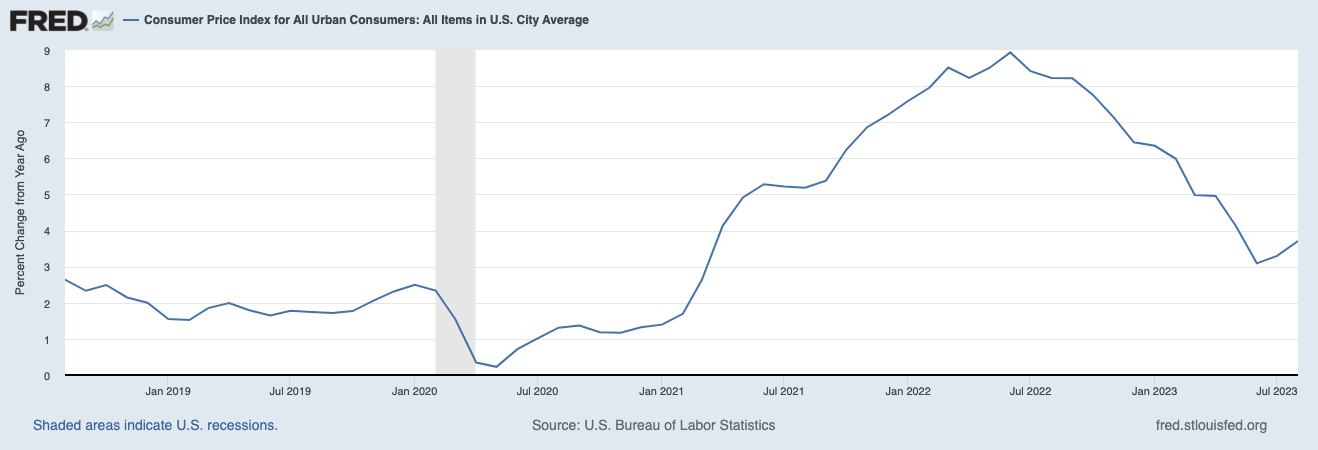
In June of 2023, the CPI was 3.0%. It’s now 3.7%. And with oil now above $90 a barrel again, it’s likely going much higher in the coming months. Again, this chart is going in the WRONG way.
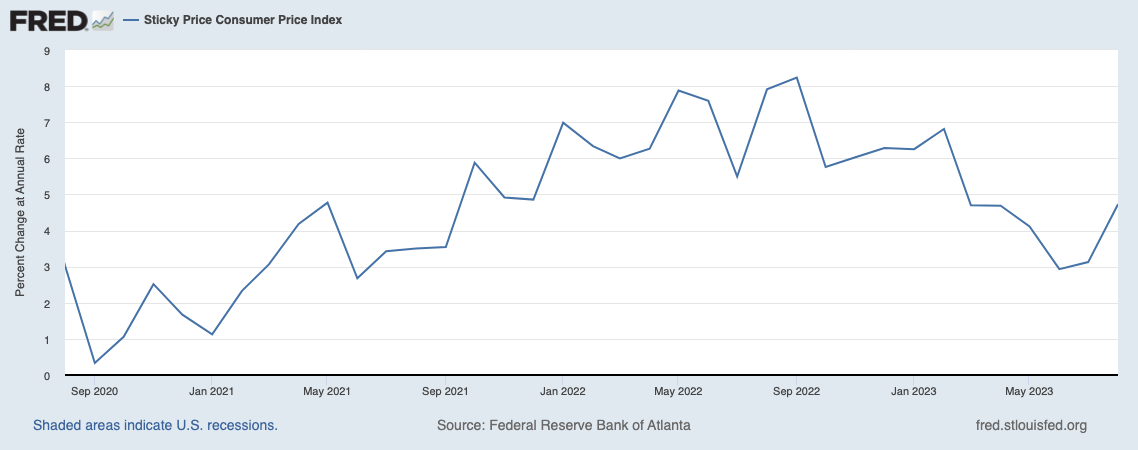
The CPI is not the only inflation metric that has rebounded. The Atlanta Fed’s “sticky inflation” metric tracks parts of inflation that are deeply embedded in the financial system. These items are “sticky” meaning that it’s much more difficult for the Fed to get rid of them. And it’s clocking in at 4.7% after dropping below 3% just a few months ago.
That’s quite a rebound.
Indeed, CPI for August clocked in at 3.7% year over year. That sounds decent until you realize that CPI was 3.0% in June. That’s quite a rebound in just two months. And bear in mind, core inflation is still well over 4%!
Take a look at what oil is doing. Does this look like inflation is under control to you?