In recent weeks, gold has reached new all-time highs in many currencies, including the US dollar, the euro and the Swiss franc. We want to take the euphoric mood among gold investors as an opportunity to focus on a fundamental topic. From our point of view, the gold sector is riddled with an elementary misunderstanding. Many gold investors and analysts operate on an erroneous assumption: they attach too much importance to annual production and annual demand. We often read that the gold price cannot drop below production costs. We would like to discuss this misconception in the following.
Every gramme of gold that is held for a variety of reasons is for sale at a certain price. Many owners would sell at a price slightly above spot, others would only sell at a substantially higher price. If, due to favorable prices, a private individual wants to sell his gold holdings that he acquired decades ago, it will not reduce the overall supply of gold. All that happens is the transfer from one private portfolio to another private portfolio. To the buyer, it makes no difference whether the gold was produced three weeks or three millennia ago.
This means the annual gold production of currently more than 3,600 tons is of relatively little significance to the pricing process. Rather, the supply side consists of all the gold that has ever been produced. The recycling of existing gold accounts for a much larger share of supply than is the case for other commodities. Paradoxically, gold is not in short supply– the opposite is the case: it is one of the most widely dispersed goods in the world. Given that its industrial use is limited, the majority of all gold ever produced is still available.
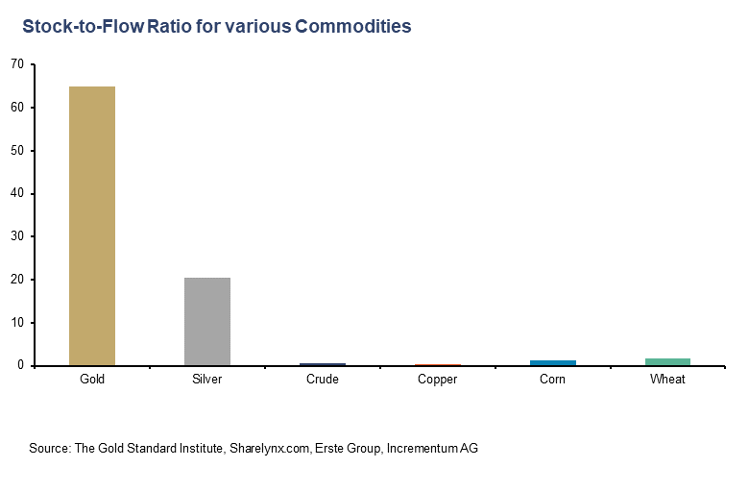
In contrast to other commodities such as oil, copper or agricultural products, there is an enormous discrepancy between annual production (= flow) and the total available stock of gold. In other words, gold has a high stock-to-flow ratio (SFR). The high stock-to-flow ratio is the most important characteristic of gold (and silver). The total gold ever mined amounts to almost 213,000 tons. Annual production in 2023 was just over 3,650 tons. Dividing the two amounts gives a stock-to-flow ratio of 58.4, which means that the current annual production must be maintained for more than 58 years to double the current gold stock.
| Total reserves in tons (stock) | % share of total reserves (stock) | |
| Jewelry | 96,500 | 45% |
| Private holdings (bars, coins, ETF) | 47,500 | 22% |
| Central bank holdings | 36,.700 | 17% |
| Others | 32,000 | 15% |
| Total | 212,600 | 100% |
| Estimated mining production (flow) | 3,600 | 1.7% of total stock |
Gold holdings are currently growing by around 1.7% a year, which is much slower than all monetary aggregates around the world. This growth is roughly in line with population growth. Confidence in the current and future purchasing power of money depends largely on how much money is currently available and how the quantity will change in the future.
Gold Stock (Above Ground Gold), in Tonnes, Money Supply (US M2), in USD bn, 1910-2023
| Year | Gold Stock | yoy | Money Supply | yoy | Year | Gold Stock | yoy | Money Supply | yoy |
| 1910 | 35,626 | 2.0% | 1970 | 90,695 | 1.7% | 626.5 | 6.6% | ||
| 1911 | 36,325 | 2.0% | 1971 | 92,145 | 1.6% | 710.3 | 13.4% | ||
| 1912 | 37,030 | 1.9% | 1972 | 93,535 | 1.5% | 802.3 | 13.0% | ||
| 1913 | 37,724 | 1.9% | 1973 | 94,885 | 1.4% | 855.5 | 6.6% | ||
| 1914 | 38,387 | 1.8% | 26.0 | 1974 | 96,135 | 1.3% | 902.1 | 5.4% | |
| 1915 | 39,091 | 1.8% | 30.0 | 15.4% | 1975 | 97,335 | 1.2% | 1,016.2 | 12.6% |
| 1916 | 39,776 | 1.8% | 34.9 | 16.3% | 1976 | 98,545 | 1.2% | 1,152.0 | 13.4% |
| 1917 | 40,407 | 1.6% | 40.9 | 17.1% | 1977 | 99,755 | 1.2% | 1,270.3 | 10.3% |
| 1918 | 40,985 | 1.4% | 46.2 | 12.9% | 1978 | 100,965 | 1.2% | 1,366.0 | 7.5% |
| 1919 | 41,535 | 1.3% | 52.0 | 12.7% | 1979 | 102,175 | 1.2% | 1,473.7 | 7.9% |
| 1920 | 42,042 | 1.2% | 51.3 | -1.4% | 1980 | 103,395 | 1.2% | 1,599.8 | 8.6% |
| 1921 | 42,540 | 1.2% | 45.7 | -10.9% | 1981 | 104,675 | 1.2% | 1,755.5 | 9.7% |
| 1922 | 43,021 | 1.1% | 50.5 | 10.5% | 1982 | 106,015 | 1.3% | 1,905.9 | 8.6% |
| 1923 | 43,575 | 1.3% | 50.7 | 0.4% | 1983 | 107,415 | 1.3% | 2,123.5 | 11.4% |
| 1924 | 44,167 | 1.4% | 53.9 | 6.3% | 1984 | 108,875 | 1.4% | 2,306.4 | 8.6% |
| 1925 | 44,758 | 1.3% | 57.6 | 6.9% | 1985 | 110,405 | 1.4% | 2,492.1 | 8.1% |
| 1926 | 45,360 | 1.3% | 56.1 | -2.5% | 1986 | 112,015 | 1.5% | 2,728.0 | 9.5% |
| 1927 | 45,957 | 1.3% | 56.7 | 1.1% | 1987 | 113,675 | 1.5% | 2,826.4 | 3.6% |
| 1928 | 46,560 | 1.3% | 58.2 | 2.6% | 1988 | 115,545 | 1.6% | 2,988.2 | 5.7% |
| 1929 | 47,169 | 1.3% | 57.7 | -0.9% | 1989 | 117,555 | 1.7% | 3,152.5 | 5.5% |
| 1930 | 47,817 | 1.4% | 54.3 | -5.8% | 1990 | 119,735 | 1.9% | 3,271.8 | 3.8% |
| 1931 | 48,512 | 1.5% | 47.7 | -12.3% | 1991 | 121,895 | 1.8% | 3,372.2 | 3.1% |
| 1932 | 49,266 | 1.6% | 44.3 | -7.1% | 1992 | 124,155 | 1.9% | 3,424.7 | 1.6% |
| 1933 | 50,059 | 1.6% | 42.9 | -3.1% | 1993 | 126,435 | 1.8% | 3,474.5 | 1.5% |
| 1934 | 50,900 | 1.7% | 49.4 | 15.0% | 1994 | 128,695 | 1.8% | 3,486.4 | 0.3% |
| 1935 | 51,824 | 1.8% | 58.4 | 18.3% | 1995 | 130,925 | 1.7% | 3,629.5 | 4.1% |
| 1936 | 52,854 | 2.0% | 66.6 | 14.0% | 1996 | 133,215 | 1.7% | 3,818.6 | 5.2% |
| 1937 | 53,954 | 2.1% | 62.7 | -5.8% | 1997 | 135,665 | 1.8% | 4,032.9 | 5.6% |
| 1938 | 55,124 | 2.2% | 68.4 | 9.0% | 1998 | 138,165 | 1.8% | 4,375.2 | 8.5% |
| 1939 | 56,354 | 2.2% | 77.5 | 13.3% | 1999 | 140,735 | 1.9% | 4,638.0 | 6.0% |
| 1940 | 57,664 | 2.3% | 90.1 | 16.3% | 2000 | 143,325 | 1.8% | 4,925.0 | 6.2% |
| 1941 | 58,744 | 1.9% | 103.4 | 14.7% | 2001 | 145,925 | 1.8% | 5,433.8 | 10.3% |
| 1942 | 59,864 | 1.9% | 133.9 | 29.6% | 2002 | 148,475 | 1.7% | 5,772.0 | 6.2% |
| 1943 | 60,760 | 1.5% | 168.8 | 26.0% | 2003 | 151,015 | 1.7% | 6,067.3 | 5.1% |
| 1944 | 61,573 | 1.3% | 191.3 | 13.3% | 2004 | 153,435 | 1.6% | 6,418.3 | 5.8% |
| 1945 | 62,335 | 1.2% | 215.6 | 12.7% | 2005 | 155,905 | 1.6% | 6,681.9 | 4.1% |
| 1946 | 63,195 | 1.4% | 226.4 | 5.0% | 2006 | 158,275 | 1.5% | 7,071.6 | 5.8% |
| 1947 | 64,095 | 1.4% | 238.0 | 5.1% | 2007 | 160,625 | 1.5% | 7,471.6 | 5.7% |
| 1948 | 65,027 | 1.5% | 234.6 | -1.4% | 2008 | 162,925 | 1.4% | 8,192.1 | 9.6% |
| 1949 | 65,991 | 1.5% | 234.0 | -0.3% | 2009 | 165,415 | 1.5% | 8,496.0 | 3.7% |
| 1950 | 66,870 | 1.3% | 244.5 | 4.5% | 2010 | 168,246 | 1.7% | 8,801.8 | 3.6% |
| 1951 | 67,753 | 1.3% | 258.1 | 5.6% | 2011 | 171,145 | 1.7% | 9,660.1 | 9.8% |
| 1952 | 68,621 | 1.3% | 268.1 | 3.8% | 2012 | 174,057 | 1.7% | 10,459.7 | 8.3% |
| 1953 | 69,485 | 1.3% | 271.0 | 1.1% | 2013 | 177,196 | 1.8% | 11,035.0 | 5.5% |
| 1954 | 70,450 | 1.4% | 278.4 | 2.7% | 2014 | 180,571 | 1.9% | 11,684.9 | 5.9% |
| 1955 | 71,397 | 1.3% | 284.6 | 2.2% | 2015 | 183,945 | 1.9% | 12,346.8 | 5.7% |
| 1956 | 72,375 | 1.4% | 288.1 | 1.3% | 2016 | 187,498 | 1.9% | 13,213.4 | 7.0% |
| 1957 | 73,395 | 1.4% | 286.0 | -0.7% | 2017 | 191,048 | 1.9% | 13,857.9 | 4.9% |
| 1958 | 74,445 | 1.4% | 297.0 | 3.8% | 2018 | 194,693 | 1.9% | 14,362.7 | 3.6% |
| 1959 | 75,575 | 1.5% | 298.6 | 0.6% | 2019 | 198,295 | 1.9% | 15,320.7 | 6.7% |
| 1960 | 76,765 | 1.6% | 312.4 | 4.6% | 2020 | 201,738 | 1.7% | 19,114.6 | 24.8% |
| 1961 | 77,995 | 1.6% | 335.5 | 7.4% | 2021 | 205,309 | 1.8% | 21,546.6 | 12.7% |
| 1962 | 79,285 | 1.7% | 362.7 | 8.1% | 2022 | 208,921 | 1.8% | 21,346.3 | -0.9% |
| 1963 | 80,625 | 1.7% | 393.2 | 8.4% | 2023 | 212,582 | 1.8% | 20,827.2 | -2.4% |
| 1964 | 82,015 | 1.7% | 424.7 | 8.0% | |||||
| 1965 | 83,455 | 1.8% | 459.2 | 8.1% | |||||
| 1966 | 84,905 | 1.7% | 480.2 | 4.6% | |||||
| 1967 | 86,325 | 1.7% | 524.8 | 9.3% | |||||
| 1968 | 87,765 | 1.7% | 566.8 | 8.0% | |||||
| 1969 | 89,215 | 1.7% | 587.9 | 3.7% |
Annual gold production is relatively small
What does this mean in concrete terms? If mine production were to double – which is extremely unlikely – this would only mean an increase of 3.4% for the total stock of gold. This would still be a relatively insignificant inflation of the gold stock, especially compared to the current central bank inflation. If, on the other hand, production were to cease for a year, this would also have little impact on the total stock and pricing. If, on the other hand, a significant proportion of oil production were to be lost for a longer period of time, stocks would be depleted after a few weeks. Strong increases or decreases in production can therefore be absorbed much more easily.
We therefore assume that gold is not so valuable because it is so rare, but quite the opposite: gold is valued so highly because the annual production is so low in relation to the stock. This characteristic has been acquired over the centuries and can no longer change. This stability and security is a key prerequisite for creating trust. This clearly distinguishes gold as a monetary metal from other commodities and precious metals. Commodities are consumed, while gold is hoarded. This also explains why conventional supply/demand models can only be used to a limited extent on the gold market. Or as Robert Blumen once put it: “Contrary to the consumption model, the price of gold does clear the supply of recently mined gold against coin buyers; it clears all buyers against all sellers and holders. The amount of gold available at any price depends largely on the preferences of existing gold owners, because they own most of the gold.”[1]
For a commodity that is consumed, a rising deficit would clearly trigger higher prices until equilibrium is restored. Not so with a good that is hoarded. A simple consumption model therefore only works for goods that are consumed and whose annual production is high in relation to the stock (= low stock-to-flow ratio).
Current mining costs are insignificant for the gold price
This is why the production costs of gold play a subordinate role in pricing. They are primarily relevant for the performance of gold stocks. In our opinion, analyses that state that the gold price cannot fall below production costs are based on a fundamental fallacy. Although mining would be uneconomical for the majority of mine operators above a certain price, trading in gold that has already been mined would not come to a standstill. While mining therefore has little influence on the gold price, the reverse is not true. The gold price naturally has a considerable influence on mining and its profitability.[2]
There is no generally equal production cost rate for all mines – the costs depend on the characteristics of the mine and the reserves. Even the cost of producing individual ounces from the same mine can vary. The gold price in relation to labor costs and the cost price of capital goods determines whether a mine is profitable or not, and what gold can be profitably extracted from a mine. As the price of gold rises in relation to production costs, previously unprofitable reserves can become profitable to mine.
The demand side consists of investors, the jewelry industry, central banks and industry. However, this is actually only a fraction of the total demand. The majority of demand is so-called reservation demand. This term describes gold owners who do not want to sell gold at the current level. By not selling at the current price level, they are responsible for ensuring that the price remains at the same level.[3]
The decision not to sell gold at the current price level is therefore just as important as the decision to buy gold. The net effect on price discovery is the same. The supply of gold is therefore always high. At a price of USD 5,000, the supply of old gold would amount to a multiple of annual production. This also explains why the much-cited “gold deficit” is a myth and why there can be no shortage. Robert Blumen once formulated this aspect as follows: “Gold is an asset. Supply and demand should be understood in the same way that we understand the shares of a company. Every time shares change hands, the shares are demanded by a buyer and supplied by a seller. For each and every transaction, supply equals demand. Adding up all of the transactions that occur on a particular exchange, over the course of a month or a year, tells you absolutely nothing…If you said that buyers in China had bought 100 million shares of Microsoft but ‘no supplier could supply that many shares,’ nor was the company issuing enough new shares to meet the demand, you would readily see the error in that statement… Everyone understands that new shares only dilute the value of the existing shareholders, that it is not required for a company to issue new shares for the price to go up or down and that most trading of shares consists of existing shareholders selling to people who have dollars.”[4]
Just as increasing the money supply dilutes the purchasing power of the money in circulation and issuing new shares leads to a dilution of the old ones, an increase in the supply of gold should be seen as a dilution of the existing supply. An increase of 1% is absorbed by the market by the price falling by 1%, while the nominal supply remains the same.
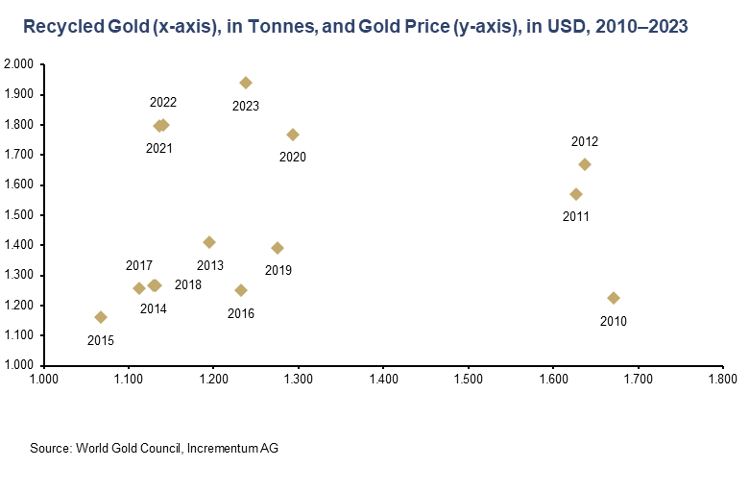
With the exception of the past four years, there is a clear positive correlation between the gold price in US dollars and the expanding supply of recycled gold. The low volume of recycled gold in relation to the gold price over the past four years could indicate that market participants are becoming accustomed to the higher price level and will only sell at significantly higher price levels. It also appears that gold is gradually moving from shaky to firm hands.
Whenever someone sells, it means that the gold price has reached its reserve price. Thus, someone is selling to someone with an implicitly higher reservation price – which results from the fact that they are willing to buy at that price. This means that larger sales (for example by central banks) contribute to an improvement in the market structure.
Conclusion
The gold market should be seen as a holistic market. In our opinion, the distinction between annual new supply and total supply is incorrect and leads to false conclusions. All sources of supply are of equal value, as every ounce of gold available for sale is in competition with other ounces. It does not matter whether the gold was mined 3,000 years ago or 3 months ago or consists of recycled dental gold, for example. The current annual gold production of more than 3,600 tons is therefore relatively insignificant for pricing.
Annual gold production is also only subject to very minor fluctuations, in contrast to fiat money, whose annual rate of change fluctuates strongly. Over the past quarter of a century, M1 for the euro has fluctuated on a quarterly basis between just under -10% in Q3/2023 and +17% in Q4/2005, while M2 for the US dollar has gone from -4.1% in Q2/2023 to more than +25% in Q1/2021. Ludwig von Mises summarized these theoretical findings perfectly: “If a thing has to be used as a medium of exchange, public opinion must not believe that the quantity of this thing will increase beyond all bounds.”
[1] Blumen, Robert: “Does Gold Mining Matter?”, Mises Institute, August 14, 2009
[2] See Blumen, Robert: “Does Gold Mining Matter?”, Mises Institute, August 14, 2009
[3] See Blumen, Robert: „WSJ does not understand how the gold price is formed“, May 30, 2010
[4] Blumen, Robert: “Does Gold Mining Matter?”, Mises Institute, August 14, 2009
Ronni Stoeferle
VON GREYERZ AG
Zurich, Switzerland
Phone: +41 44 213 62 45
VON GREYERZ AG global client base strategically stores an important part of their wealth in Switzerland in physical gold and silver outside the banking system. VON GREYERZ is pleased to deliver a unique and exceptional service to our highly esteemed wealth preservation clientele in over 90 countries.
VONGREYERZ.gold
Contact Us