The housing “bubble” in the late 2000s looks quaint by comparison now. The rise of socialism in America is a direct result of this chart.

The housing “bubble” in the late 2000s looks quaint by comparison now pic.twitter.com/VdfaGgeqJm — Alec Stapp (@AlecStapp) April 26, 2026 Mortgage is biggest scam. Always pay cash for house (unless you got in at 3%). Else rent . https://t.co/noDRJON7Nc — tic toc (@TicTocTick) April 25, 2026 The rise of socialism in America is a direct …
READ MORE

Regional banks control nearly 1/3 of US commercial mortgages, but hidden risks in CRE are 4X higher than reported. 08 is going to look bullish in comparison.

Regional banks now hold almost one-third of all U.S. commercial mortgages and a majority of non-owner-occupied CRE, and “latent distress” is about 4X larger than what current delinquency rates imply.🧵 CRE: ~ $4.8 T Consumer debt: $5.58T (auto: $1.66T, Student loan: $1.65 T) 1. Chief Risk Officer of a regional bank admitted on the call …

READ MORE

The cost to buy is surging far beyond renting. Income needed to buy a house now dwarfs median U.S. income, making the subprime bubble seem minor by comparison.

https://imgur.com/cost-to-buy-significantly-outpacing-cost-to-rent-now-posted-response-to-rental-price-increases-VMXMPkM Income needed to buy a house vs. median income in the US. Subprime bubble looks almost cute in this chart. Ht @nickgerli1 pic.twitter.com/zPfUf2uaDc — Michael A. Arouet (@MichaelAArouet) December 13, 2024 All one needs to know about successful investing in one sophisticated chart 👇 pic.twitter.com/mspgDVgXtJ — Michael A. Arouet (@MichaelAArouet) May 8, 2021 Over …

READ MORE

When CPI returns to trend, 2008 will seem minor; only 1929 offers a true comparison.

Everyone forgets the 18 month depression of 1920 arriving shortly after the Spanish Flu. Mass unemployment following the war similar to AI unemployment. A period of record inflation followed by the Fed raising interest rates sharply over a shorter period, just like today. https://t.co/W1xfe4U3Go — Financelot (@FinanceLancelot) September 23, 2024 When CPI returns to trend …

READ MORE

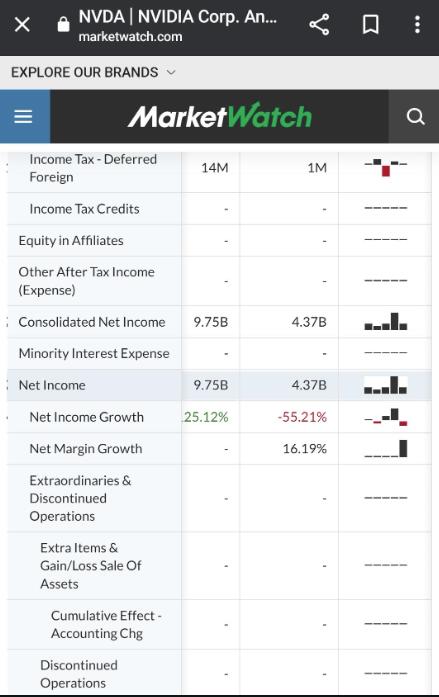
NVDA made only $4.37B in 2023 and currently has a $1.7T market cap. For comparison, MSFT made $72B in 2023 and has a $3T market cap.

by Domethegoon Nvidia’s market cap soars to $1.7 trillion, adding $750 billion in just 70 days, raising eyebrows over its valuation. With 2023 earnings at $4.37 billion compared to Microsoft’s $72 billion, questions arise about the sustainability of this remarkable ascent. Is the hype justified, or is there a looming reality check for Nvidia’s staggering …

READ MORE

Uh-oh! It looks like you're using an ad blocker.

Our website relies on ads and the generous support of readers like you to keep delivering free, high-quality content. Right now, we are facing serious funding challenges and we need your help more than ever. Disable your ad blocker and this message will vanish. You can also sign up for a membership to enjoy an ad-free experience while supporting our work: https://citizenwatchreport.com/plans/subscriptions/ Your support helps us stay independent, continue our work, and keep content free for everyone. We truly appreciate your understanding and thank you for standing with us.