📸 June foreclosure snapshot:
TOP THREE US STATES:
• Florida: 1 in every 2,106 housing units (4,871 filings)
• South Carolina: 1 in every 2,374 (1,029 filings)
• Indiana: 1 in every 2,377 (1,252 filings)⚠️National June rate: 1 in every 3,656 housing units (39,327 total… pic.twitter.com/ZuTyIlKLRh
— Creations Real Estate (@CreationsEstate) July 19, 2026
The housing market is not in 2008 yet.
But investors rarely wait until every warning light turns red.
By the time a housing collapse appears clearly in official data, the market has usually been sending signals for months or years.
Right now, two separate data points are starting to point in the same direction.
Foreclosures are rising.
The buyer pool is shrinking.
ATTOM reported 227,500 foreclosure filings during the first half of 2026.
That is up 21% from the same period last year and roughly 28% to 30% higher than two years ago.
June alone recorded 39,327 foreclosure filings.
The national rate reached about one foreclosure filing for every 3,656 housing units.
The hotspots are becoming easier to identify.
Florida recorded 4,871 filings, around one for every 2,106 housing units.
South Carolina was around one for every 2,374.
Indiana was around one for every 2,377.
These numbers are still nowhere near the 2008 financial crisis.
That comparison matters.
The peak housing crash produced millions of foreclosure filings.
Today’s numbers are only a fraction of that level.
But focusing only on the distance from 2008 misses the more important question.
Why are foreclosures accelerating again?
The housing market spent years in an unusual environment.
Millions of homeowners locked in ultra-low mortgage rates.
Government support programs delayed many defaults.
Housing supply remained tight.
Prices climbed.
But the protection is fading.
Homeowners are now dealing with a completely different cost structure.
Mortgage rates remain much higher than the pandemic era.
Insurance costs have surged in many states.
Property taxes continue increasing.
Everyday expenses have reduced household flexibility.
The result is growing pressure on owners who bought at the edge of affordability.
The foreclosure numbers are one warning sign.
The second warning sign is happening on the demand side.
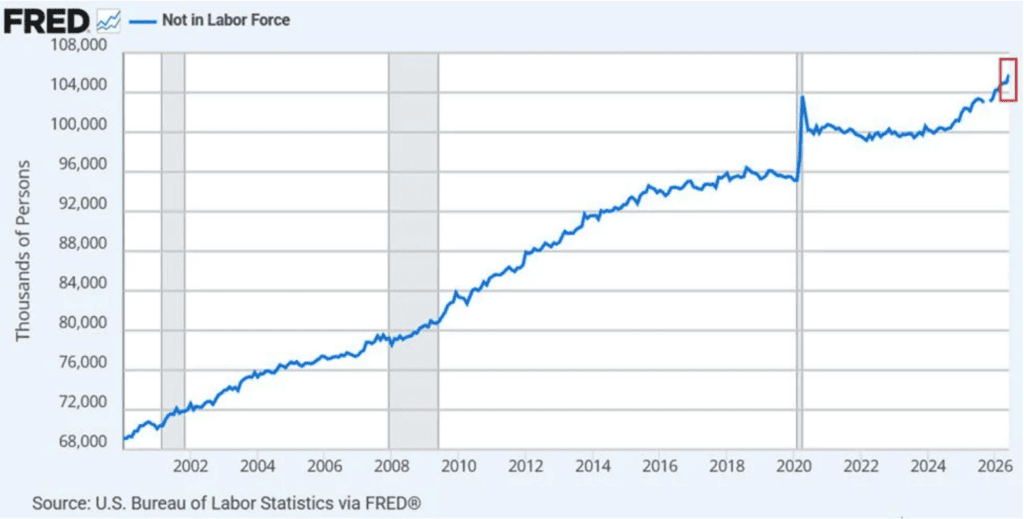
The United States now has a record 105.8 million people outside the labor force.
That means they are not working and not actively looking for work.
The number increased by 832,000 in June alone.
Around 2.5 million people have exited the labor force so far in 2026.
The labor force participation rate remains around 61.5%.
Outside the pandemic period, participation is near the weakest levels seen in decades.
About 38.5% of Americans age 16 and older are now outside the labor force.
The breakdown matters.
This is not simply a story of millions of discouraged workers.
Roughly:
52% are retirees.
16% are in school.
16% are out because of illness or disability.
13% are caring for family or home responsibilities.
Only around 3% are classified as discouraged workers.
The biggest driver is demographics.
The Baby Boomer retirement wave is real.
Thousands of Americans reach retirement age every day.
But housing markets do not care why someone leaves the workforce.
A retired household, a person who stopped searching for work, and someone unable to participate economically all represent fewer potential buyers.
That creates the hidden problem.
Housing depends on two groups.
Existing owners who can continue paying.
Future buyers who can afford to enter.
Both sides are facing pressure.
The foreclosure increase shows stress among owners.
The labor force decline shows weakness among future buyers.
That combination is what makes this situation worth watching.
The market has been supported for years by one powerful force.
Too many buyers chasing too few homes.
But what happens when the buyer pool starts shrinking while distressed supply begins increasing?
That is where the next phase becomes complicated.
The aging population could also create another supply wave in the future.
As millions of older Americans downsize, move into assisted living, or pass homes to heirs, more properties could eventually come onto the market.
At the same time, younger buyers are dealing with higher prices, higher borrowing costs, and weaker affordability.
The pressure is not evenly distributed.
Some areas will feel it first.
Florida has become one of the biggest warning zones, where homeowners are dealing with expensive insurance and rising costs.
Other states showing elevated foreclosure activity are starting to attract attention as well.
Local homeowners are already reporting more distressed properties appearing in certain communities.
A few neighborhoods do not create a national crisis.
But major housing downturns rarely begin with a national headline.
They begin with smaller cracks spreading through weaker areas.
The biggest mistake investors make during long cycles is waiting for confirmation.
Markets move when expectations change.
They do not wait until every foreclosure has happened, every homeowner has sold, and every economic report admits weakness.
The housing bubble may not have broken yet.
But the pressure points are moving closer together.
Record labor force exits.
Rising foreclosure filings.
A weaker future buyer pool.
The warning signs are appearing before the damage becomes obvious.