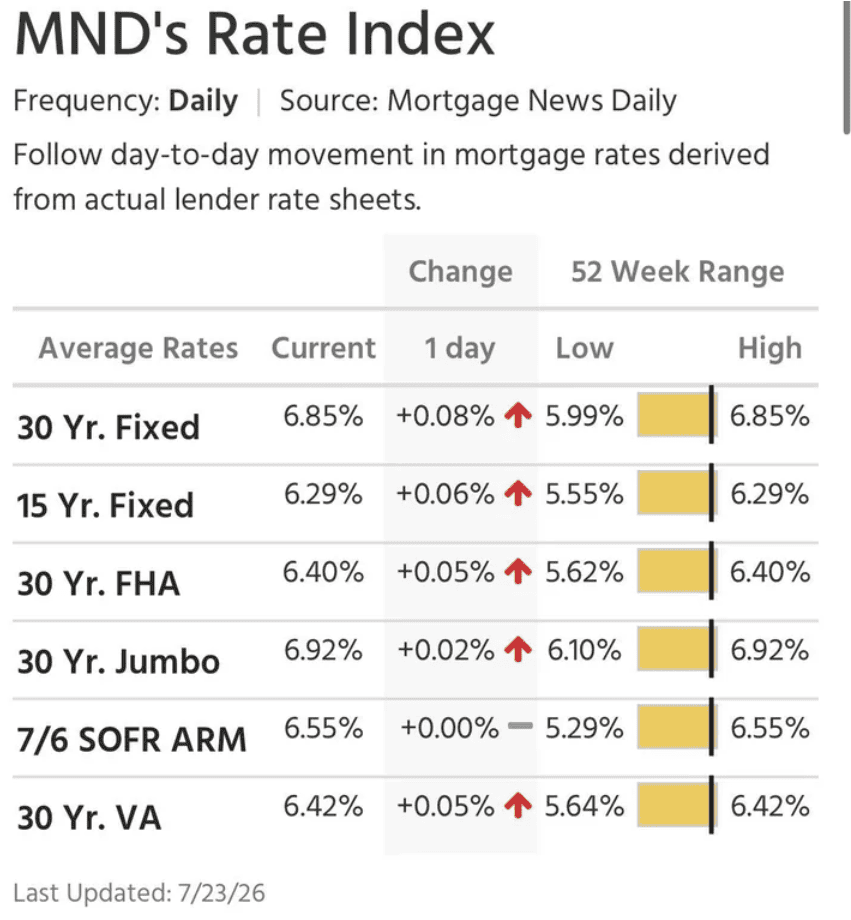
Average 30 year fixed rate reading at 6.85 percent highest of the year so far.
Same day last year was 6.78 percent.
10 year Treasury yield at 4.70 percent.
Spread sitting at 215 basis points.
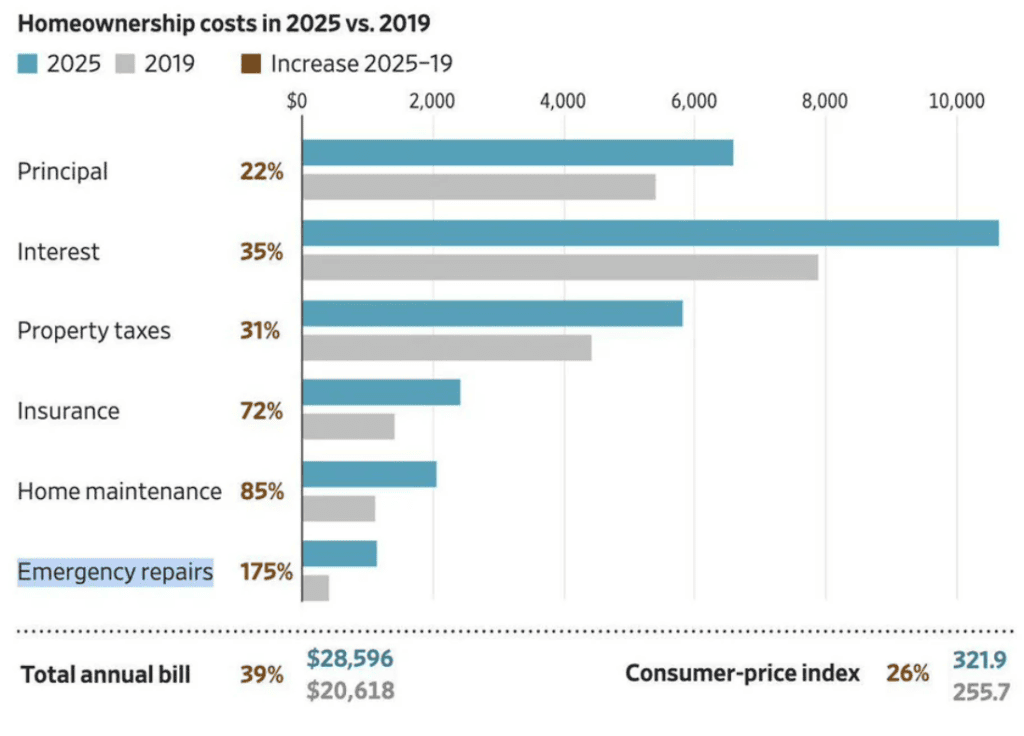
Emergency repairs up 175 percent since 2019.
Maintenance costs up 85 percent.
Homeowners insurance up 72 percent.
Interest costs up 35 percent.
Property taxes up 31 percent.
Principal payments up 22 percent.
Overall ownership expenses feel much heavier for new buyers.
“Goldman Sachs estimates that home prices are between 48%-52% overpriced at 6.8% mortgage rates.
House prices show a sensitivity of 12–13% to a 1 percentage-point drop in rates (over time).
So what does that mean today? Mortgage rates have increased by 4 percentage points from the bottom in 2020.
By Goldman’s estimates, homes are currently overpriced by 48%-52%.
Except home prices don’t just fall, first the market stalls, sales slump, homeowners pull their home off the market because they still think their house is worth 2022 prices.
Federal Reserve (Greenspan & Kennedy, 2005): Declining mortgage rates combined with easier credit standards explained roughly 50% of real home-price growth between 1995 and 2005.
Harvard Joint Center for Housing Studies (JCHS) and Moody’s Analytics: Approximately 35–40% of real home-price appreciation since the 1980s can be attributed to falling borrowing costs.
Goldman Sachs (2022): House prices show a sensitivity of 12–13% to a 1 percentage-point drop in rates (over time). From 1981 to 2021, rates fell by about 15 percentage points, implying a compounded pure-rate-driven price increase of more than 100%.
Himmelberg, Mayer & Sinai (2005): Using the user-cost framework, they show that lower real long-term interest rates are a primary fundamental driver of higher house prices (via reduced annual ownership costs). Declines in rates can justify substantial price-to-rent ratio increases without implying a bubble.
Glaeser, Gottlieb & Gyourko (NBER, 2010): “Can Cheap Credit Explain the Housing Boom?” — While acknowledging that lower rates raise prices, they estimate a more modest contribution than some industry models (often in the lower end of the 30–70% range or below for the 1996–2006 boom). They argue interest-rate declines alone cannot fully account for the magnitude of the price run-up in many markets once supply and other demand factors are considered.
Recent elasticity estimates (various academic and policy papers, including Federal Housing Finance Agency / OFR work and European studies): Long-run semi-elasticities of house prices to mortgage rates commonly fall in the 4–13% range per 1 percentage-point change (higher when debt-service constraints bind or rates are already very low). Mortgage-rate shocks have been found to explain roughly 2–25% of house-price variation in some variance-decomposition exercises.
Minton & co-authors (Harvard JCHS working paper, 2024–2026): In the post-2021 period of rising rates, “rate lock” (homeowners reluctant to sell and give up low fixed-rate mortgages) itself explained about 40% of the gap between predicted price declines and actual observed price growth from 2021 to 2023 — illustrating the ongoing importance of the interest-rate channel, now operating partly through supply constraints.
Across decades of research, lower interest rates and borrowing costs are consistently found to explain a large majority share (commonly cited in the 30–70% range) of real home-price appreciation.
Other factors income growth, demographics, land-use restrictions, and expectations—account for the remainder.”
Goldman Sachs estimates that home prices are between 48%-52% overpriced at 6.8% mortgage rates.
House prices show a sensitivity of 12–13% to a 1 percentage-point drop in rates (over time).
So what does that mean today? Mortgage rates have increased by 4 percentage points from…
— Darth Powell (@VladTheInflator) July 24, 2026