via Tom McClellan
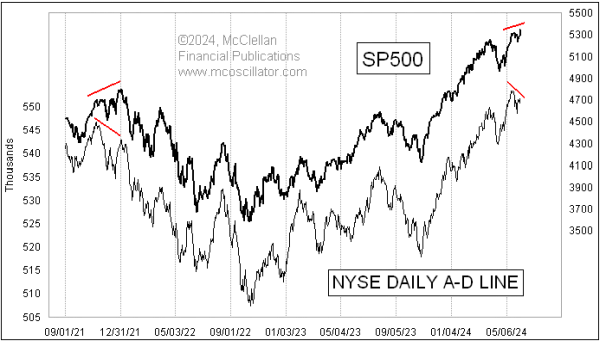
The SP500 is up to a new all-time high, but the NYSE’s Advance-Decline (A-D) Line is not confirming that. This is a sign of trouble, because it means that the concentration of buying in certain big cap stocks which drive the major averages is not being confirmed by what the rest of the market is doing.
A cumulative daily A-D Line is calculated by tabulating the number of stocks going up every day (Advances) and subtracting the ones who close down (Declines). That daily A-D difference is known as “the daily breadth”. An A-D Line is a running tabulation of all prior data, and it changes each day by the value of the daily breadth number.
Most of the time, the NYSE’s A-D Line will echo what prices are doing. That is the normal behavior. But I watch the NYSE’s A-D Line carefully all the time, because historically a bearish divergence like what we are seeing now has been a big sign of trouble. Most price indices are dominated by the largest capitalization stocks, but every stock gets an equal vote in the A-D Line.