by 1two3Fore

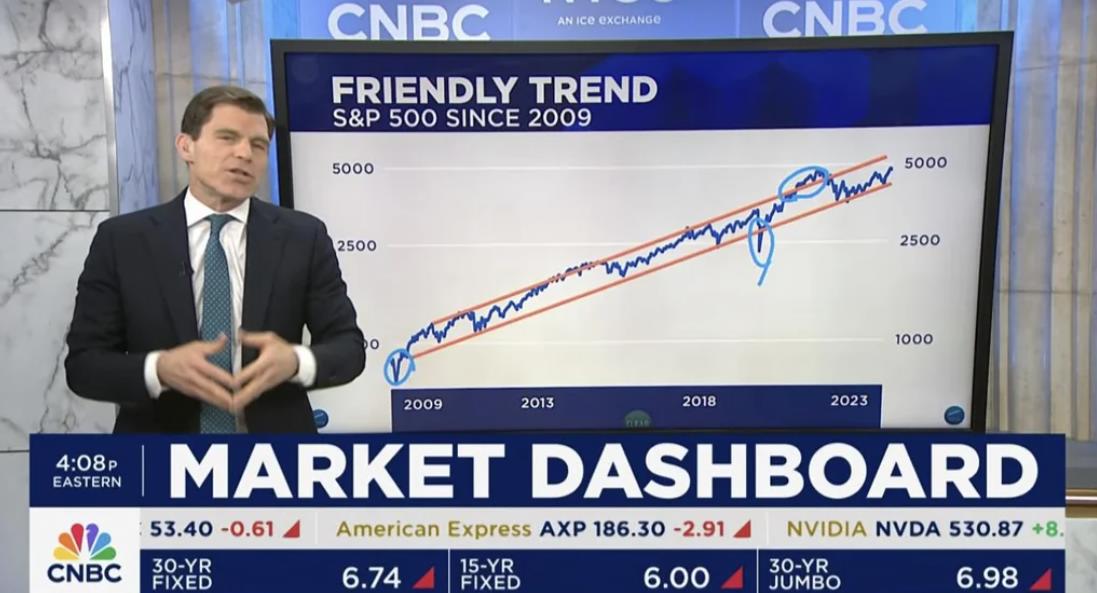
Is CNBC over here trying to suggest that the channel between 2009 and 2024 is “nice?” Or are they trying to say these are the “normal” and “expected”resistance and support levels of the SP500?
This is a perfect chart demonstrating what “growth” will look like moving forward, assuming 1 important underlying factor:
QE and low interests rates!
I guess endlessly printing $$, bailing out corporations, and keeping corporate taxes near $0 is quite “Friendly.”