The $USD is breaking down… in a big way.
The greenback peaked in October 2022. After plunging some 11% from October 2022 to January 2023, the $USD has since been moving in a range or what trader’s would call a “consolidation phase.”
There are a couple key issues to consider when you look at a consolidation phase. They are:
1) How long it lasts.
2) Whether the eventual breakout is a continuation or a reversal of the prior trend.
Regarding #1, the length of a consolidation phase is closely correlated with the significance of the eventual breakout: the longer the consolidation phase, the more significant the breakout.
In the case of the $USD, it’s been in a consolidation phase for SIX MONTHS. That is a significant length of time. And it tells us that the eventual breakout is of major importance.
Regarding #2, it’s critical to note whether an eventual breakout continues the trend the asset was in prior to consolidating or whether it reverses said trend. If the breakout is a continuation, then the asset is in a MAJOR trend, and the consolidation was simply a kind of “breather” between major moves.
That appears to be the case with the $USD today. The trend was down before it began consolidating. And now it is breaking down in a big way. This suggests that the $USD is in a MAJOR downtrend that will last for some time.
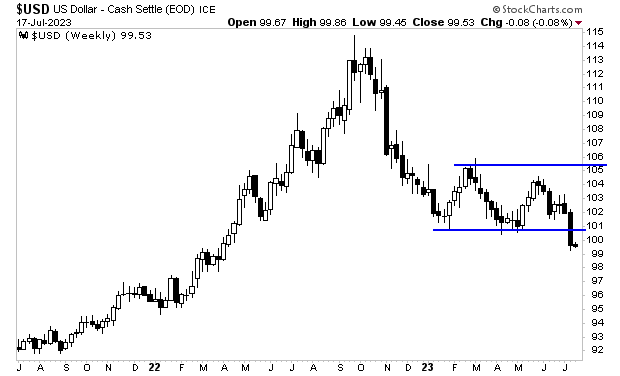
Finally, remember we are talking about the $USD here… arguably the most important asset in the world. This breakdown will have a MAJOR impact on the markets, particularly those that benefit from higher inflation/ a weaker $USD.