The drop in the number of publicly traded U.S. companies is continuing. I last reported on that here back in April. Since then, the losses in the Nasdaq have leveled off just a little bit, but the NYSE continues to lose listed issues.
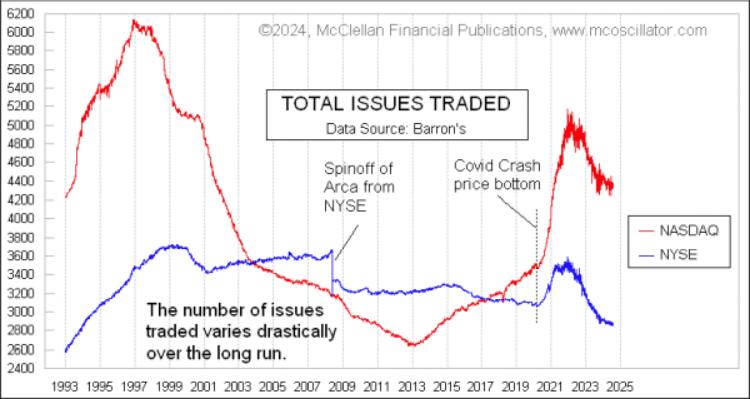
Several different factors have affected these totals over time, the most prominent of which is the availability of liquidity. In the growth years of the 1990s, when Alan Greenspan was starting to worry about “irrational exuberance” (1996), both markets saw rapid growth in the numbers of issues traded. The Nasdaq market’s total listings peaked in December 1996, more than 3 years before the final price top. And the NYSE’s listings peaked in early 1999, still well ahead of when the Internet Bubble’s price peak came.
For several years in the 2000s, the electronic-only exchange now known as NYSE ARCA had its numbers included in the tally of NYSE issues. That changed when that exchange was spun off in June 2008.
The long decline in Nasdaq listings finally bottomed out in early 2013, which was shortly after QE3 started. That round of QE ended in 2014, but the growth of issues continued. It got a big boost in 2020, when the Fed and Congress conspired to throw a whole lot of money at the problems brought about by the Covid Crash. Both the NYSE and the Nasdaq peaked in their numbers of traded issues in 2022, just as that year’s bear market was about to start.
The 2022 bear market ended in October 2022, but the decline in the numbers of issues traded has continued. There are as many reasons for this as there are delisted companies. But the best explanation, at least for the Nasdaq, is that the excesses built up during the Covid-related monetary expansion are still getting unwound.
It gets harder to explain the continued losses of traded companies in the NYSE. Its total is now down to a level last seen in 1993. Interestingly, most of the losses have been in issues which are not categorized as “common stocks”. The total number of issues traded on the NYSE is down by more than 700 since the 2022 top, but only about 100 of those are common stocks.
The common stocks now make up 63% of the total NYSE list, up from the mid-50s% just a few years ago. The rest are what I like to call the “uncommon” issues, which are made up of preferred stocks (16%), bond closed end funds or CEFs (6%), other CEFs (7%), and SPACs (7%).
It is not bullish news overall that liquidity is leading to a drying up of the numbers of issues traded, but it has not affected the major indices yet. It was a big problem in 2000, especially for the Nasdaq.
By the time that the Nasdaq Composite Index peaked in March 2000, the number of Nasdaq traded issues had already fallen by 17%. The foundations were crumbling for a long time before the final top came.
Now in September 2024, the number of Nasdaq traded issues is down 16% from the 2022 high. And thus far, the major averages are not showing any sign of any liquidity problems. Neither are the breadth statistics, with the NYSE A-D Line at a new all-time high. I believe that the drying up of all the Covid money is going to matter at some point. I cannot demonstrate that we are at that point just yet. But we are on the way.
Tom McClellan
Editor, The McClellan Market Report
Views: 123