The S&P 500’s risk-adjusted returns just hit their peak, and history isn’t kind after that.

These patterns don’t just appear for fun. They’re often a sign that sentiment is shifting, and the easy gains might be over. If history repeats, the next move won’t be straight up. According to @sentimentrader, the S&P 500’s one-year #Sharpe ratio has peaked, which historically leads to periods of volatile/moderate returns.@SoberLook pic.twitter.com/pczWEMCacA — Lance Roberts …

READ MORE

Dollar’s surge threatens Asia’s markets, mirroring 1980s Latin American crisis. S&P 500’s five-day decline mirrors 2022 and 1987 market crashes.

pic.twitter.com/BmgN8RzSM3 — Jack Krzewinski (@JackKrzewinski) January 2, 2025 "The relentless surge of the U.S. dollar is primed to cut a swath of carnage through Asia’s asset markets, leaving economic strain in its wake. The dollar wrecking ball similar wreaked havoc with Latam currencies in the 1980s… Historically, when the dollar flexes its muscle,… pic.twitter.com/y9Sc5afXM0 — …

READ MORE

S&P 500’s best two-year gain since 1998 ends with a historic losing streak. 2025 could see a historic collapse, with a potential 40-60% decline.

The S&P 500 closed 2024 with its best two-year gain since the dot-com bubble years of 1997 and 1998. Yet it ended the year with four consecutive daily losses, a year-end losing streak that hasn't happened since 1966, the year stocks peaked before entering a 16-year bear market. — Peter Schiff (@PeterSchiff) January 1, 2025 …

READ MORE

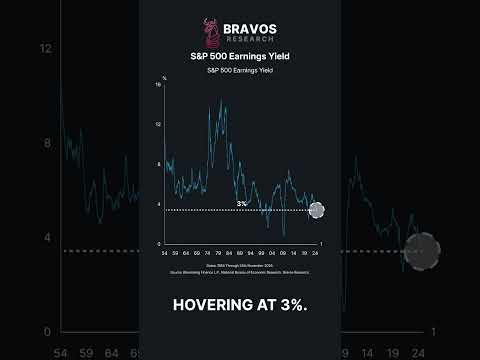
S&P 500’s current P/E ratios mimic levels during the Dot-Com Bubble; caution advised!

‼️S&P 500 IS AS EXPENSIVE AS DURING THE DOT-COM BUBBLE‼️ 90% of the market sectors have their P/E ratios in the top 25% historically. This is in line with levels seen during the Dot-Com Bubble and before the 2022 bear market. Long-term expected returns are not promising now. pic.twitter.com/8ECIeiuVR4 — Global Markets Investor (@GlobalMktObserv) September …

READ MORE

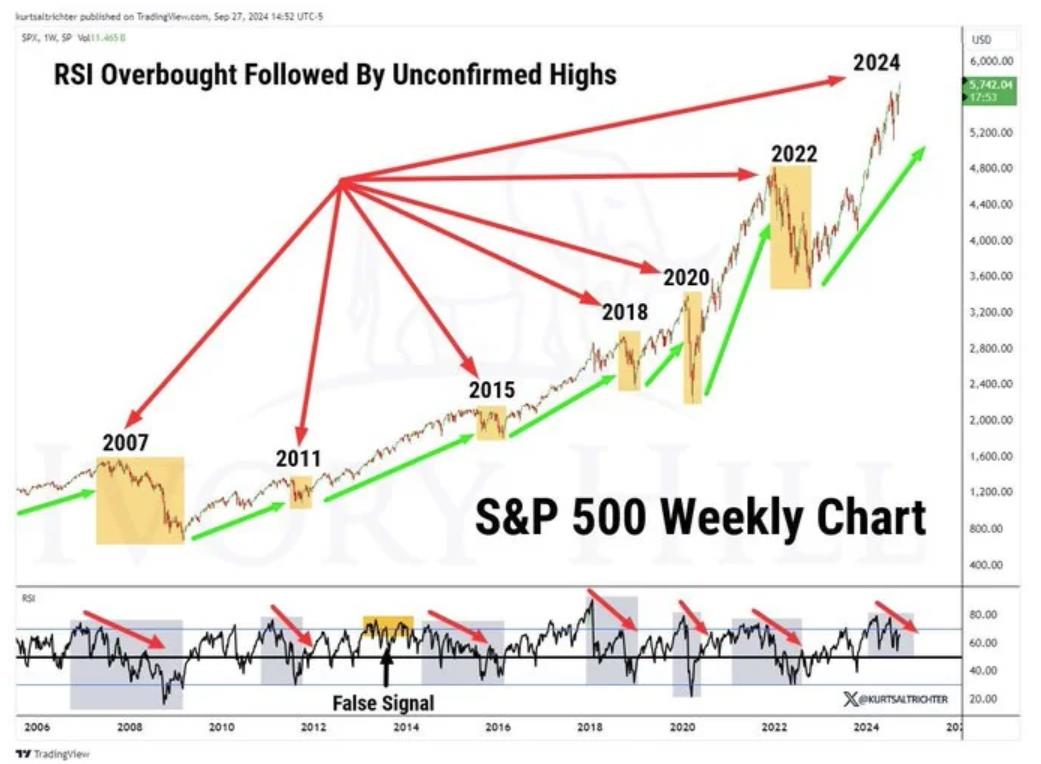
John P. Hussman, Ph.D.: S&P 500’s minor dip masks deeper risks; rebound after volatility spike isn’t reassuring near overbullish highs.

"The hits just keep on comin'" – Casey Kasem This one today – in case you're told the initial rebound after a volatility spike is a good thing. Not so much when the market is still near divergent, overbullish, record highs. Not an investment strategy, not a forecast. Just FYI. pic.twitter.com/e0q21AkQxg — John P. Hussman, …

READ MORE

Financials are at a record high in bullishness, while the S&P 500’s revenue beat rate is at its lowest since the fourth quarter of 2016.

Financials Bullishness pic.twitter.com/6tEnWECJJ6 — Win Smart, CFA (@WinfieldSmart) July 25, 2024 S&P 500's earnings beat rate is still healthy at nearly 79%, but the revenue beat rate is currently at its lowest since the fourth quarter of 2016 pic.twitter.com/7QmvLufdG1 — Win Smart, CFA (@WinfieldSmart) July 25, 2024 https://twitter.com/MichaelAArouet/status/1816441931850797083 The streak of days without a 2% …

READ MORE

The S&P 500’s price to peak earnings ratio has soared to 25.9, the highest since 2000…. Nasdaq: Large Engulfing candle, followed by a falling window.

The S&P 500's price to peak earnings ratio has moved up to 25.9, its highest level since 2000 and 50% above the historical median. $SPXhttps://t.co/l5IYmkf6Ih pic.twitter.com/DFI74St163 — Charlie Bilello (@charliebilello) July 17, 2024 Nasdaq Large Engulfing candle, followed by a falling window 2 major warnings🚨 Engulfing is a bearish trend reversal candle. Falling window is …

READ MORE

S&P 500’s highs rely on Tech; Nvidia’s stock split could signal decline, recession ahead.

As we see in the chart below, in recent years the S&P 500 has made no new highs without Tech leadership. Which is unfortunate, because it appears that the Nvidia is having its Gamestop moment ahead of this impending stock split (tomorrow after the close).… pic.twitter.com/bU54jn9mKh — Mac10 (@SuburbanDrone) June 6, 2024 Bitcoin Update . …

READ MORE

Nvidia drives ~43% of S&P 500’s YTD gains; market resembles 2008, overvalued stocks.

Nvidia accounts for a staggering 43% of the S&P 500’s gains year-to-date, highlighting the dismal breadth of the market. Many stocks are down while tech continues to monopolize attention, reminiscent of the unsettling patterns seen in 2008. If you’re bullish and believe the Fed will cut rates soon, you must recognize that stocks are now …

READ MORE

S&P 500’s 9.6% rally raises concerns

https://twitter.com/iamhodler_/status/1726563939658662350 🇺🇸 US continuing jobless claims continues to closely track the average of past #recession cycles. Using the months from first inversion of the 10Y3M Treasury yield curve since 1968 (excluding COVID). H/t: @DonMiami3 pic.twitter.com/XhUirbQB8D — Alex Joosten (@joosteninvestor) November 20, 2023

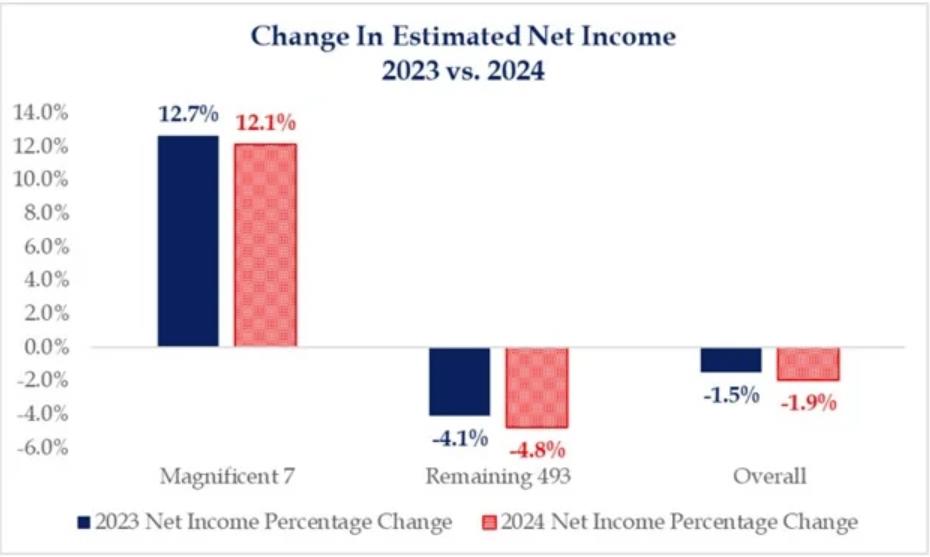
Over 100% of the S&P 500’s Net Income growth is from the Big 7; Only 10 stocks in the S&P 500 make up 90% of its gains this year

by mrmrmrj A mere 7 corporate giants are single-handedly generating over 100% of the S&P 500’s profit growth, with a mere 10 stocks shouldering 90% of the market’s gains this year. This high level of dependence on a select few raises red flags, as the fate of these companies now dictates the health of the …

READ MORE

Uh-oh! It looks like you're using an ad blocker.

Our website relies on ads and the generous support of readers like you to keep delivering free, high-quality content. Right now, we are facing serious funding challenges and we need your help more than ever. Disable your ad blocker and this message will vanish. You can also sign up for a membership to enjoy an ad-free experience while supporting our work: https://citizenwatchreport.com/plans/subscriptions/ Your support helps us stay independent, continue our work, and keep content free for everyone. We truly appreciate your understanding and thank you for standing with us.