via Tom McClellan
Every US president and Treasury secretary claims to favor a strong dollar, although they usually secretly wish for a weaker dollar, to make US exports more attractive. But I am betting none of them have ever been aware of the relationship between taxes and the dollar, shown in this week’s chart.
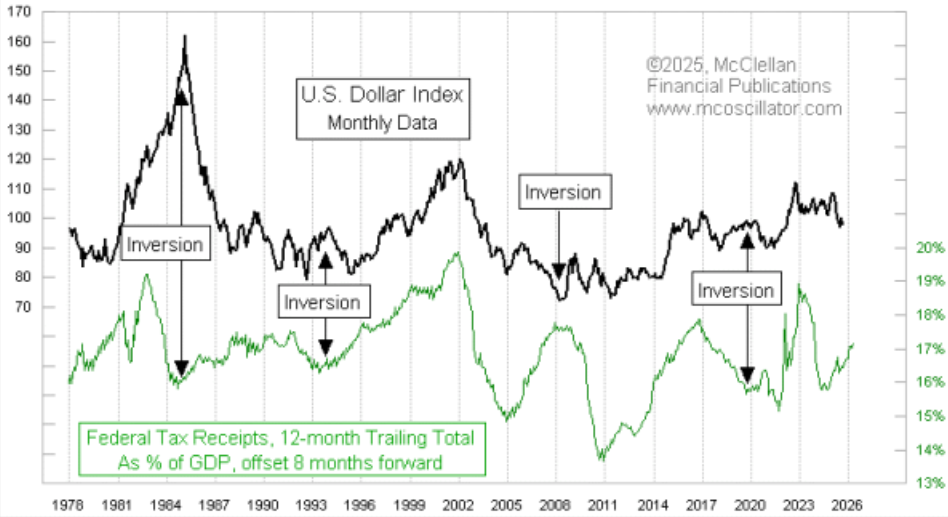
What this chart shows is the US Dollar Index, a basket of multiple world currencies’ values versus the dollar, which is dominated by the euro. Most of you are already familiar with that. The lower plot in green shows total federal tax receipts as a percentage of GDP, and that plot is shifted forward by 8 months to help us see how these two sets of data really work together. What gets revealed by this adjustment is that the value of the dollar tends to follow the path of tax receipts, with a lag time of about 8 months.
What that means for the immediate future is that the value of the dollar should be expected to rise over at least the next 8 months, based on total government revenues having risen in recent months. Part of that is the additional $30 billion a month coming in from tariffs, and another big part is from higher capital gains taxes, thanks to the rising stock market.
The big problem with this forecasting model is that about every 10-12 years we see a big inversion between the two plots. During those events, the relationship works backwards for a while, and then rights itself. I note that it is every 10-12 years, but we only have good monthly data on tax receipts back to 1980. Before then the data are only annual, so it is too hard to extend this chart back further than I show here. If it really is a 10-12 year inversion pattern, then the next event would be due in 2030-32. Or it might just be random; we don’t yet have enough years of data to make that determination.
Why would this relationship work? That is an interesting question, but not an essential one. We can see that it has worked (imperfectly) for decades, and we can acknowledge that even if we cannot explain the “why”. But we always want to know the why, so here is my theory:
It used to be that “a dollar” had a defined value, meaning that if you had $20.67 you could get one ounce of gold. President Franklin D. Roosevelt then changed that to $32, but it was still a defined value. Those days are gone, and the dollar does not have a specified value any more. It has lots of uses, though, some of which are well defined and others are less so.
The most well-defined use case for a dollar is that you can for sure pay your taxes with it. The federal government will always accept dollars as payment for its taxes. Others may be more or less willing over time to accept dollars in trade, but Uncle Sam always accepts dollars. So as the collections of taxes rise, the demand for dollars to pay those taxes rises. And if the demand for something rises, its price usually also rises.
I concede that is a pretty weak sounding causal explanation, and it does not explain the episodes of this relationship inverting, but that’s the best I have. And I will reiterate that we do not necessarily need to know the cause of a phenomenon in order to accept its validity.
Tom McClellan
Editor, The McClellan Market Report