And that's assuming:
1) No recessions – that will spike gov't spending for 1-2 years (COVID, 2008, etc).
2) No tax cuts (Tax Cuts & Jobs Act).
3) No new spending bills (Inflation Reduction Act).And, that also assumes 2-3% debt costs, not 5-6%.
— Spencer Hakimian (@SpencerHakimian) April 30, 2024
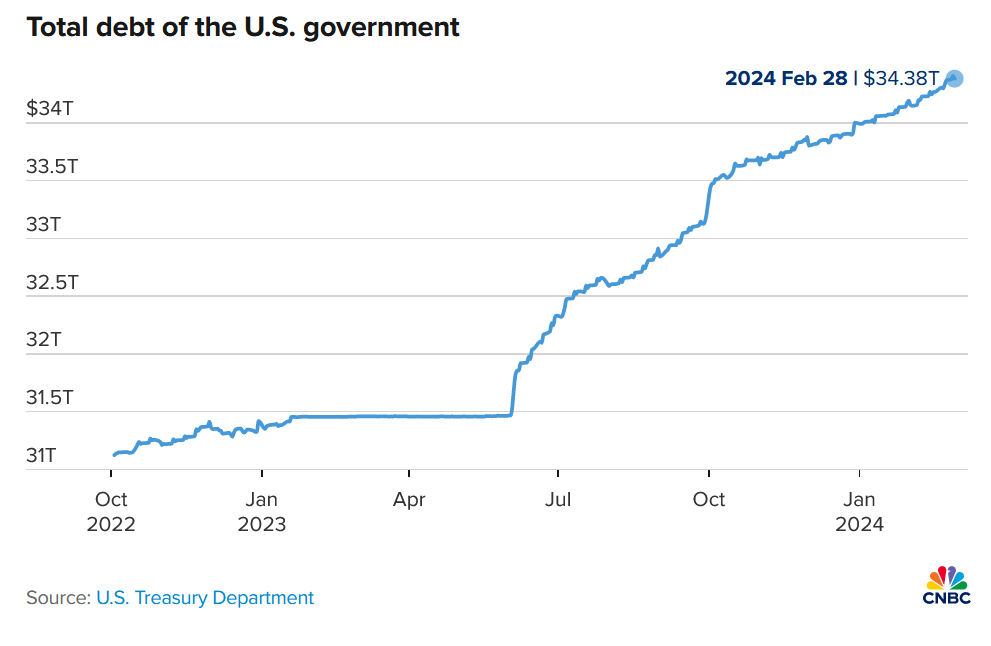
The US national debt reached roughly $34.5 trillion at the end of February, an all-time record. Since June, the debt has been increasing by $1 trillion every 100 days. As a reminder, the level of debt increases when a country spends more than it earns from taxes and other revenue. As you can see on the chart, the total US government debt passed $32 trillion on June 15, 2023, $33 trillion on September 15, 2023, and $34 trillion on January 4. If the pace continues, the $35 trillion mark will be reached in April.

Furthermore, since February 2019, the US national debt has increased by $12.5 trillion, or roughly $2.5 trillion a year. On the other hand, the US economy (GDP) has grown by $7.2 trillion in the same period, or approximately $1.44 trillion a year. It means that in the last five years for one unit of economic growth (GDP), the US government has created 1.7 units of debt. In other words, the US economy has been becoming less productive and more indebted as time passes.
https://globalmarketsinvestor.substack.com/p/the-us-national-debt-reached-345