via MishTalk:
The only time rent went negative year-over-year was in the Great Recession, even then, just barely. Yet, every month we see reports of falling rent and expectations that it soon will.

I created the above chart today because people keep saying rents will fall due to the massive number of rents under construction.
For over a year we have seen stories saying the price of rents is declining.
The Stories
- CNBC September 8, 2023: Apartment rents are on the verge of declining due to massive new supply
- CNN June 26, 2023: Rent is falling in America for the first time in years
- Realtor.Com July 3, 2023: Renters, Rejoice! Landlords Are Dropping Prices the Most in These 10 Cities
- Money.Com February 9, 2023: Rent Prices to Fall ‘Nearly Everywhere,’ Housing Expert Says
- Bloomberg January 14, 2023: The Apartment Market Is About to Get Ugly
- USA Today March 3, 2023: Rents going down, new study shows.
- KLSTV November 29, 2022: Rent prices down nationwide
- Redfin April 14, 2023: U.S. Asking Rents Post First Annual Decline in Three Years
Headlines Wrong
The headlines all have one thing thing in common: They are all wrong. Even the Wall Street journal is in on the silliness.
February 27, 2023 WSJ: Apartment Rents Fall as Crush of New Supply Hits Market
If you read the stories, they are generally based on asking prices for new rentals or the notion that supply will soon crush demand causing prices to drop.
But asking prices, even actual prices for new leases do not mean prices are falling. The number of existing leases dwarfs the number of people moving.
CPI Rent
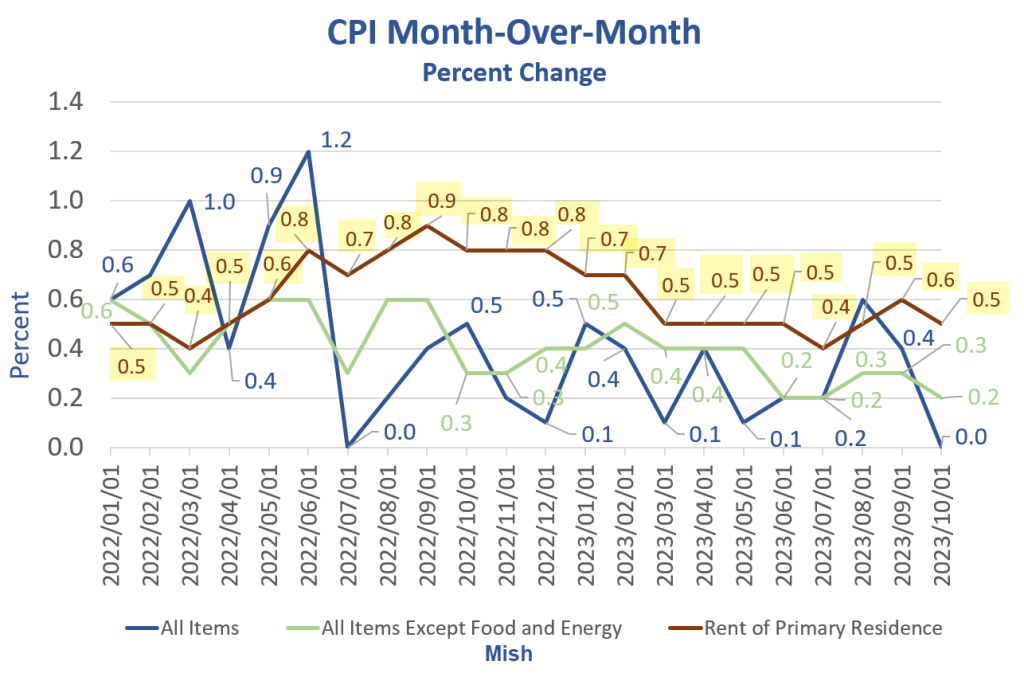
Rent of primary residence, the cost that best equates to the rent people pay, jumped 0.5 another percent in October.
Rent of primary residence has gone up at least 0.4 percent for 27 consecutive months!

People keep telling me rents are falling, I keep saying they aren’t (and the data proves it).
For discussion, please CPI Unchanged Thanks to Decline in Energy, but Rent Jumps 0.5 Percent
Let’s now put a spotlight on supply, shown in the first chart, with additional details.
Housing Units Under Construction vs Completed Units

The only time in the history of this data that rent prices declined year-over-year was in the Great Recession. And that was after completed units crashed 76.8 percent from 2.245 million annualized units to 520,000 annualized units.
A year-over-year decline in rent happened exactly once in history, May of 2010. The preceding and following months had no gain. And those were the only two months of zero percent increases year-over-year (lead chart).
Yet, every month we see nonsense about falling rent based on new leases, or soon to be falling rent based on massive supply.
The Prosecution Rests
In Mish vs the Media, rebutting the idea rents have been declining, the prosecution rests.
Rents have not been declining. Perhaps they will after 27 consecutive monthly increases of at least 0.4 percent, but history strongly suggests rent prices are sticky.
However, It will not take declining rents to make the Fed happy. Increases of 2.0 percent would. But even 2.0 percent or less increases are rare (lead chart, dashed line).
Year-over-year rent is up 7.2 percent.
Due to easy-to-beat year-over-year comparisons, perhaps that the year-over-year rate declines rapidly. But that can happen even as rent increases 0.3 percent monthly.
Thus, a year-over year decline to 2.0 percent is not necessarily a good result, just a better one.
The New Residential Construction Report Shows Housing Starts Rise 1.9 Percent
For more on residential construction, please see The New Residential Construction Report Shows Housing Starts Rise 1.9 Percent
NAHB Housing Sentiment and Traffic Head Toward the Post-Pandemic Low

The National Association of Homebuilders survey is one of the grimmest since the Covid pandemic.
For discussion, please see NAHB Housing Sentiment and Traffic Head Toward the Post-Pandemic Low
Existing Home Sales vs New Home Sales
On October 19, I noted Existing Home Sales Drop Another Two Percent to a 13-Year Low
In sharp contrast, on October 25, I noted New Home Sales Jump 12.3 Percent Smash Expectations
New home sales are much better than existing home sales because builders are offering mortgage rate buydowns, build smaller homes, and are cutting back on lot and room sizes.
Add it all up and you are not getting a bargain buying anything today. Blame the Fed for these conditions.
How the Fed Destroyed the Housing Market and Created Inflation in Pictures
For discussion of the Fed’s role in this mess, please see How the Fed Destroyed the Housing Market and Created Inflation in Pictures
The Fed is largely responsible for the Great Recession crash, but this one is totally on them.
Views: 113