via Mike Shedlock:
If the Fed is taking economic clues from the Services ISM or from energy, it’s not done hiking. Manufacturing is a different story.

Please consider the August 2023 Services ISM® Report On Business® emphasis mine.
Economic activity in the services sector expanded in August for the eighth consecutive month as the Services PMI® registered 54.5 percent, say the nation’s purchasing and supply executives in the latest Services ISM® Report On Business®. The sector has grown in 38 of the last 39 months, with the lone contraction in December of last year.
A Services PMI® above 49.9 percent, over time, generally indicates an expansion of the overall economy. Therefore, the August Services PMI® indicates the overall economy is growing for the eighth consecutive month after one month of contraction in December 2022. Nieves says, “The past relationship between the Services PMI® and the overall economy indicates that the Services PMI® for August (54.5 percent) corresponds to a 1.6-percent increase in real gross domestic product (GDP) on an annualized basis.”
The 12 industries reporting an increase in business activity for the month of August — listed in order — are: Accommodation & Food Services; Other Services; Real Estate, Rental & Leasing; Information; Public Administration; Finance & Insurance; Arts, Entertainment & Recreation; Educational Services; Construction; Wholesale Trade; Utilities; and Retail Trade. The three industries reporting a decrease in business activity for the month of August are: Agriculture, Forestry, Fishing & Hunting; Mining; and Professional, Scientific & Technical Services.
Prices paid by services organizations for materials and services increased in August for the 75th consecutive month. The Prices Index registered 58.9 percent, 2.1 percentage points higher than the 56.8 percent recorded in July, indicating a faster rate of increases and a movement from equilibrium. The August reading is the 14th in a row near or below 70 percent (with six straight months below 60 percent), following 10 straight months of readings near or above 80 percent.
Twelve services industries reported an increase in prices paid during the month of August, in the following order: Public Administration; Other Services; Educational Services; Health Care & Social Assistance; Professional, Scientific & Technical Services; Accommodation & Food Services; Construction; Utilities; Management of Companies & Support Services; Information; Finance & Insurance; and Wholesale Trade. The three industries reporting a decrease in prices for August are: Mining; Agriculture, Forestry, Fishing & Hunting; and Transportation & Warehousing.
Diffusion Index Comments
The ISM is a diffusion index, signaling direction not amount. For example a firm hiring 10 workers and a firm laying off 200 workers balances out.
And there is a survival bias and a weighting bias.
Manufacturing ISM Declines 10Straight Months, New Orders Down 12 Months

It’s a tale of two economies, goods vs services.
Manufacturing Prices
- Commodities Up in Price: Bearings; Crude Oil; Diesel Fuel; Electrical Components (10); Natural Gas* (2); Steel* (2); and Steel Products* (2).
- Commodities Down in Price: Aluminum (3); Aluminum Products; Caustic Soda (2); Corrugate Boxes; Natural Gas* (2); Paper (4); Plastic Resins (15); Polypropylene (4); Steel* (5); Steel — Hot Rolled (4); Steel — Scrap; Steel — Stainless (2); Steel Plates; and Steel Products* (3).
- *Indicates both up and down in price.
Relationship to GDP
- Manufacturing: “The past relationship between the Manufacturing PMI® and the overall economy indicates that the August reading (47.6 percent) corresponds to a change of minus-0.4 percent in real gross domestic product (GDP) on an annualized basis.”
- Services: “The past relationship between the Services PMI® and the overall economy indicates that the Services PMI® for August (54.5 percent) corresponds to a 1.6-percent increase in real gross domestic product (GDP) on an annualized basis.”
US Light Crude Blasts Through Resistance to Highest Level in 10 Months
Yesterday, I noted US Light Crude Blasts Through Resistance to Highest Level in 10 Months
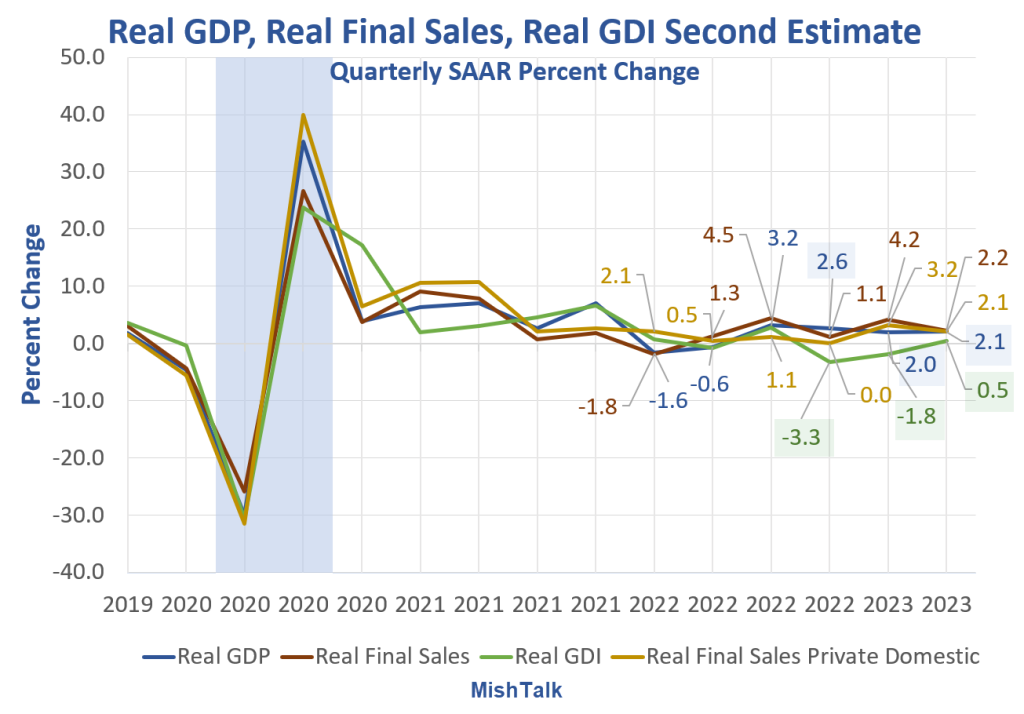
Divergence Between GDP and GDI is Stunning
GDI and the Philadelphia Fed GDPplus both signal recession, GDP doesn’t.
I have been commenting on the GDP/GDI discrepancy for many months. Yesterday, mainstream media finally noticed.
Mainstream Media Finally Wakes Up to the GDP vs GDI Recession Discrepancy

GDP vs GDI Chart Notes
- Real means inflation adjusted
- GDP is Gross Domestic Product
- GDI is Gross Domestic Income
- Real Final Sales is the bottom line assessment of GDP. It excludes inventories which net to zero over time.
GDP and GDI are two measures of the same thing. GDI tends to be more accurate in predicting recessions.
GDI was negative for two consecutive quarters and has been weaker than GDP for four quarters. GDI is now positive, but it is subject to greater revisions than GDP.
A debate is on. I side with GDI and GDPplus. The latter is a blend of GDP and GDI. GDPplus strongly suggests that the economy went into recession in the fourth quarter of 2022.
For discussion, please see Mainstream Media Finally Wakes Up to the GDP vs GDI Recession Discrepancy
We have not seen an economy anything like this one for something like forever.
Mainstream media is catching on, ironically, perhaps after the recession ended. It’s happened before. The NBER once announced a recession after it was over.
If so, we may be headed for a rare double dip. See the above link for details.