by VotedOut
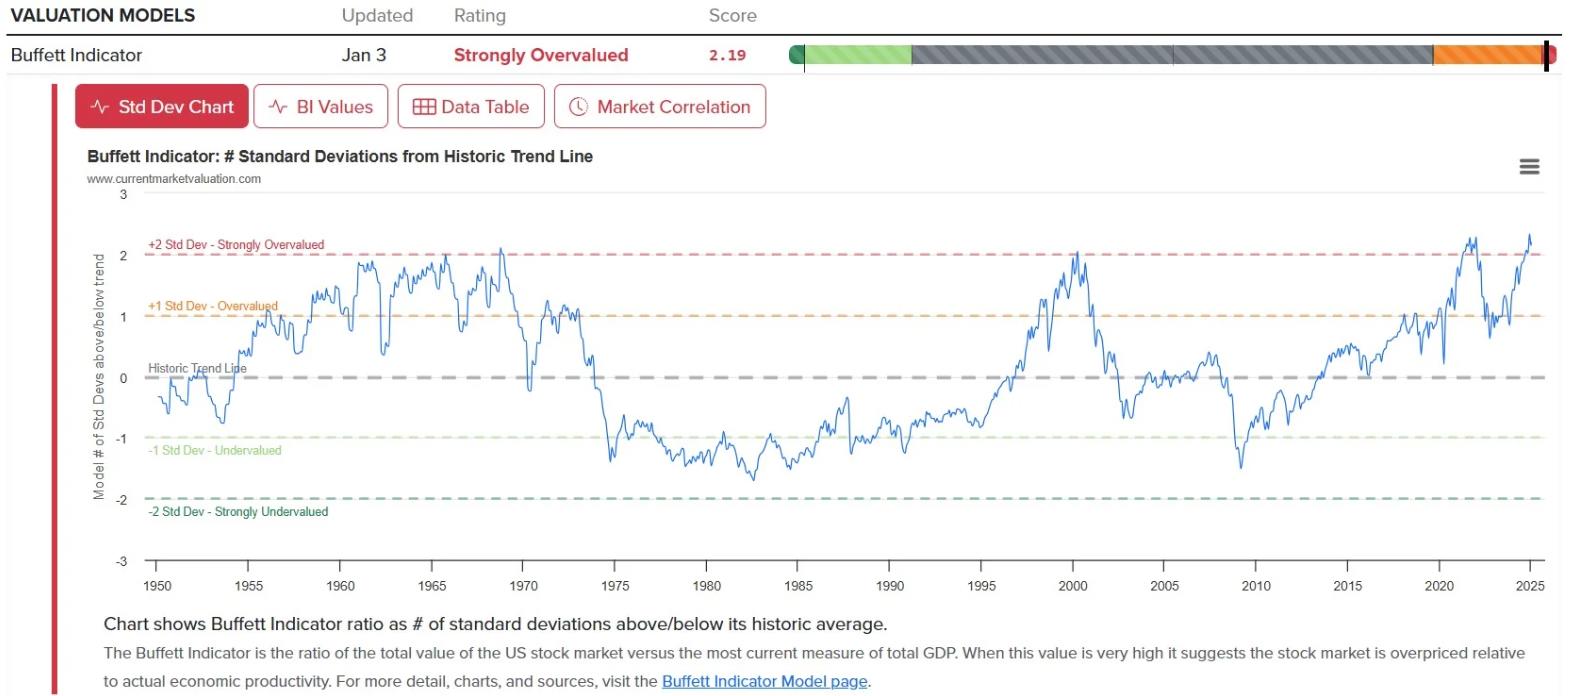
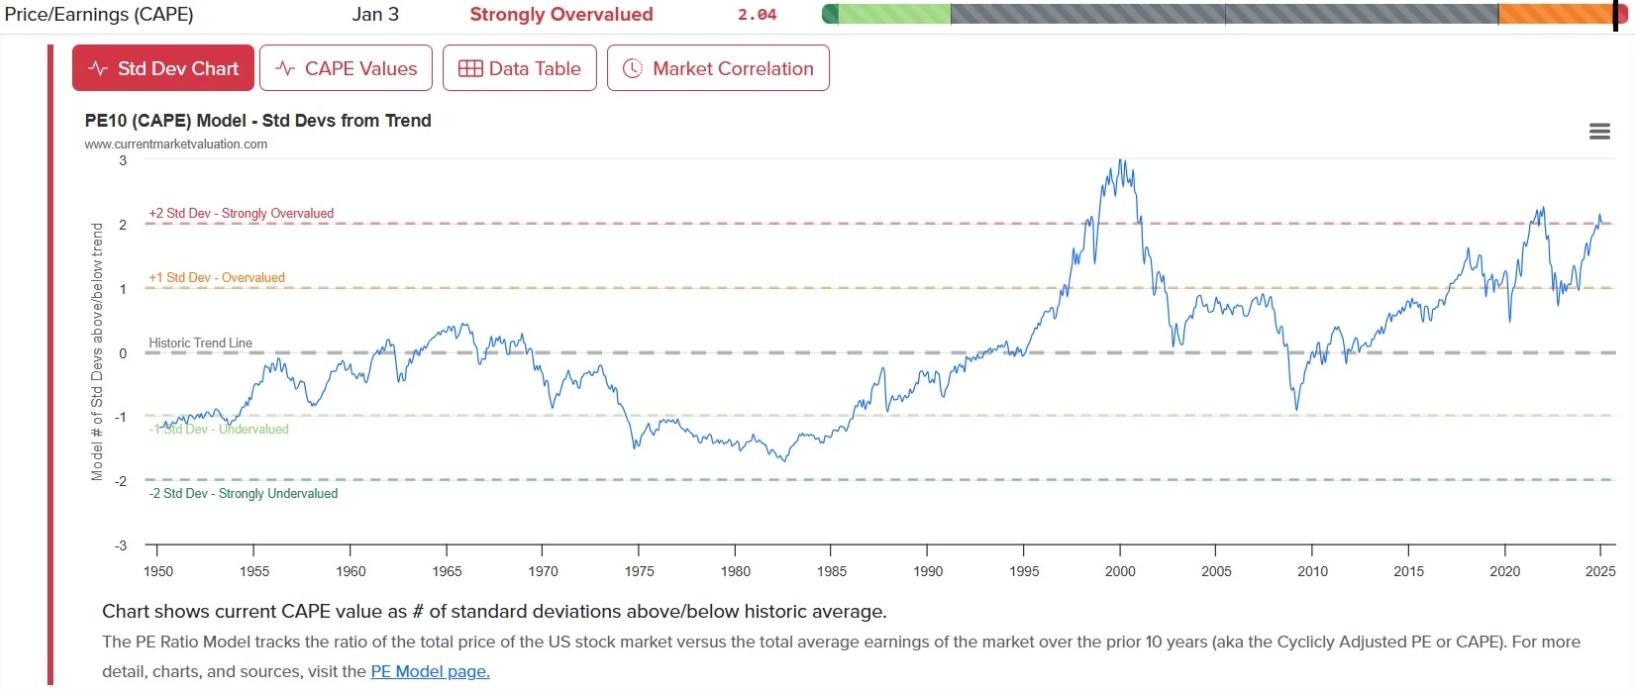
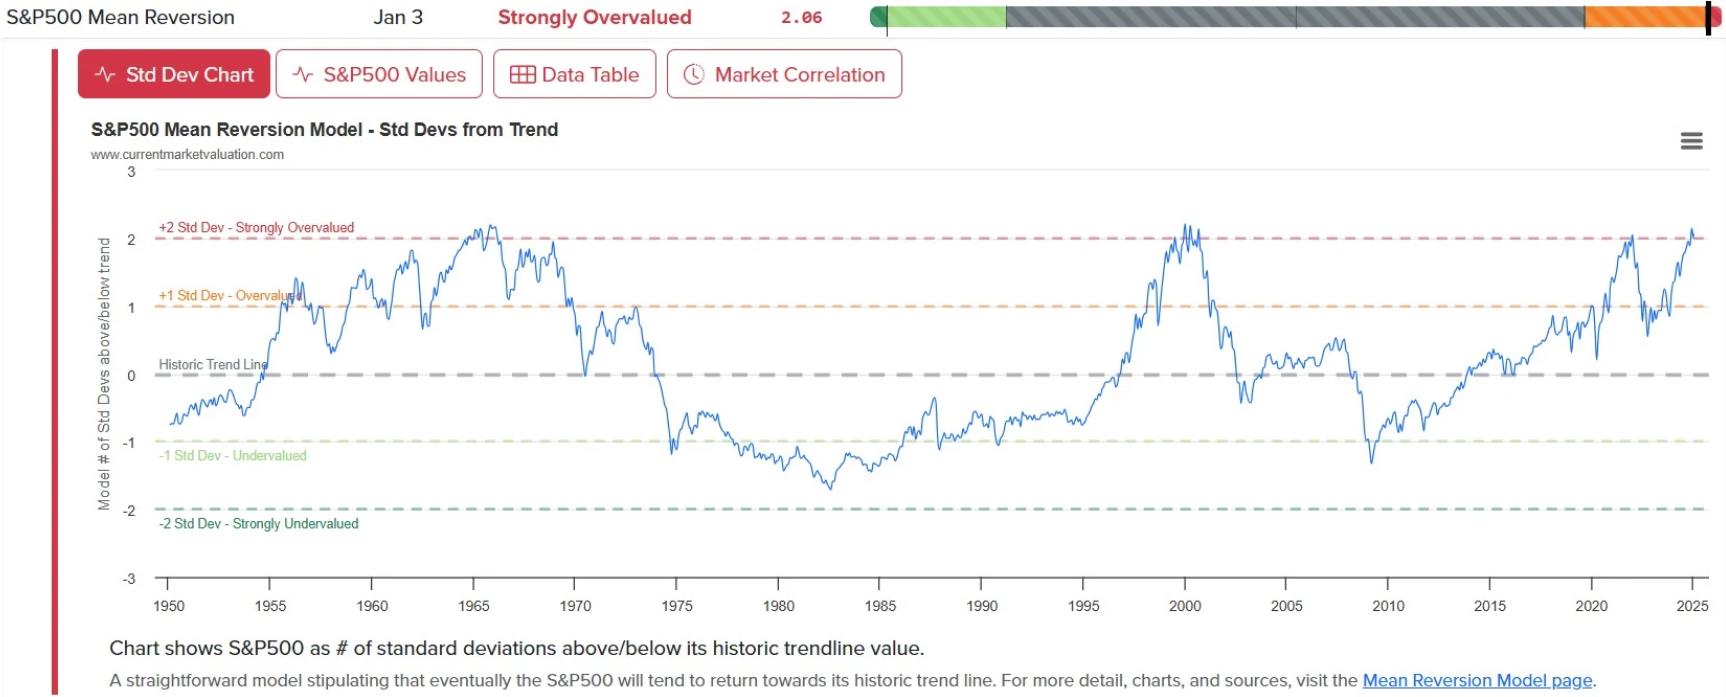
Three different U.S. stock market valuation models (the Buffett Indicator, CAPE ratio, and Mean Reversion Model – three different ways of objectively looking at the overall valuation of the current market) are flashing extreme overvaluation warning signs that were both last seen in 2000 and 2021. Both 2000 and 2021 marked market euphoria highs, and bear markets followed. You can make all your jokes that you want about gay bears successfully calling 420 of the last 69 recessions or what not, but the undeniable fact is that the track record of these three valuation models showing “strongly overvalued” in unison is 2 for 2 in “calling” bear markets that followed very quickly. Will history repeat itself again? Or is this time different (i.e. – valuations continue to “not matter” for longer)?
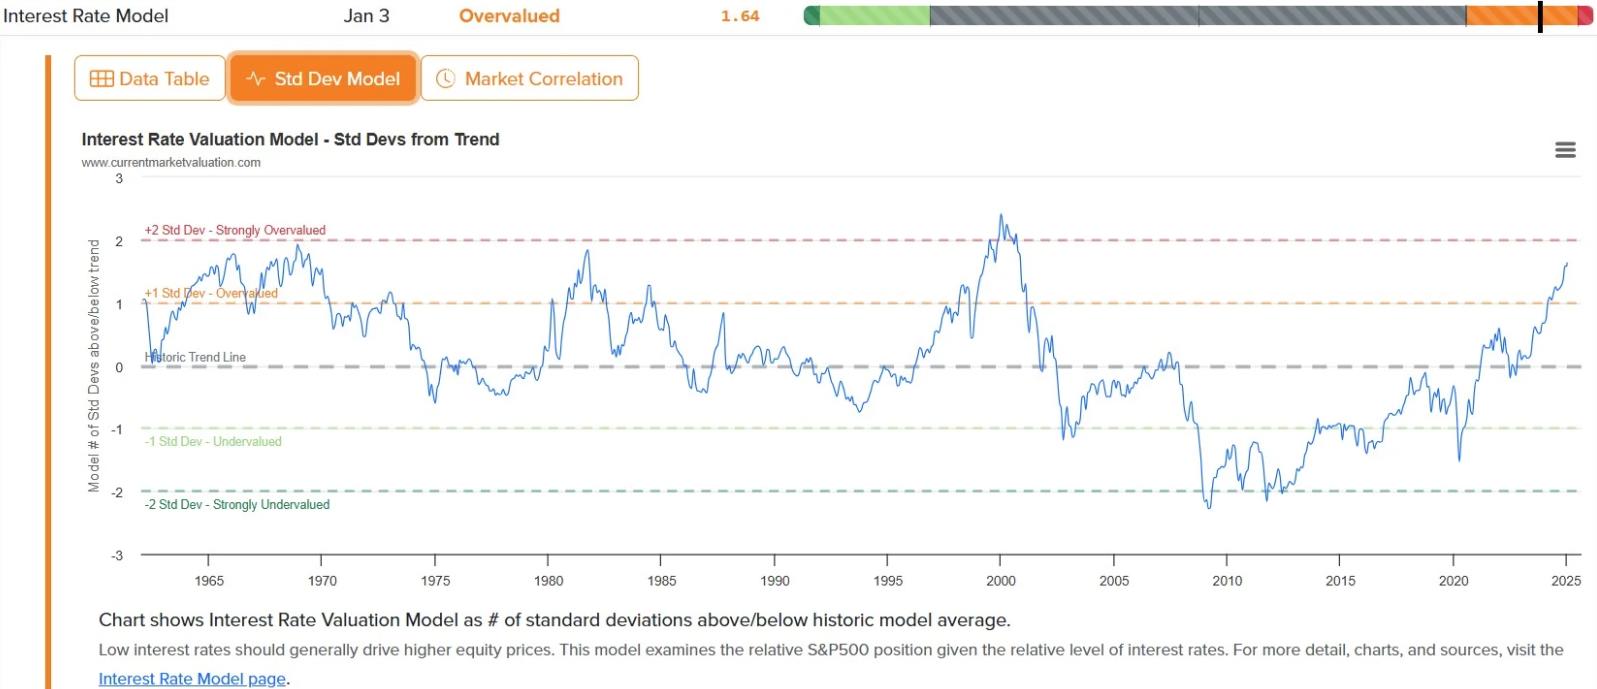
There is also a fourth model – the Interest Rate Model, which measures S&P 500 valuation relative to current 10-year treasury rate. It hasn’t quite hit the “strongly overvalued” line (it didn’t in 2021 either), but it is pretty close to it.
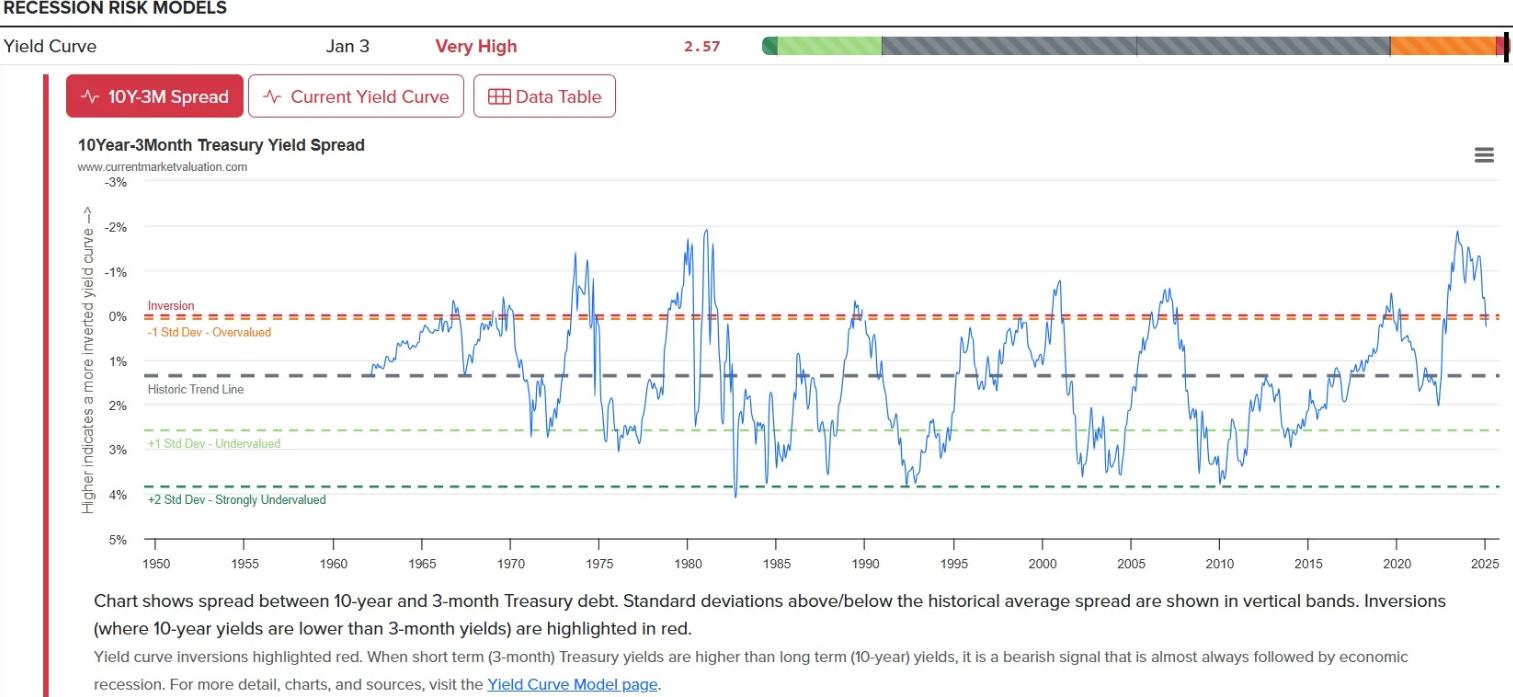
Two recession risk models – Yield Curve Inversion and the Sahm Rule – may be signaling a rough time as well.
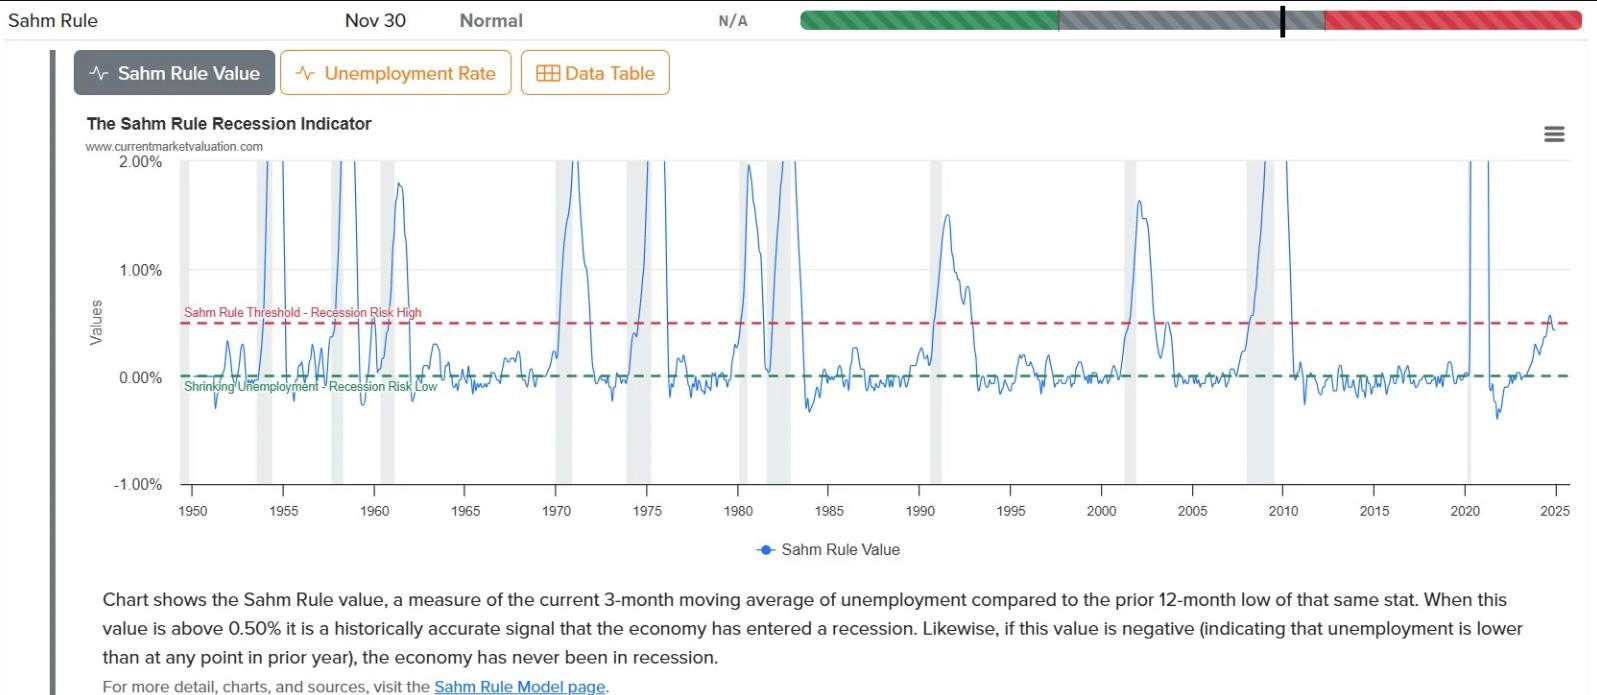
Sahm Rule value – a measure of the current 3-month moving average of unemployment compared to the prior 12-month low of that same stat. It poked just above the red line, then retreated a bit. Right now it is kind of in \”Will it or won’t it?\” mode.
…
Morgan Stanley’s Mike Wilson – US equities could face a tough six months to start the year.
not what the bears want to see.
— Tom (@TradingThomas3) January 6, 2025
73 views