Reminder, while banks have the liquidity fairy, ‘we’ get the promise of 2 more rate hikes this year, Atlanta Fed President Raphael Bostic yet again enrichens himself inappropriately from his position.
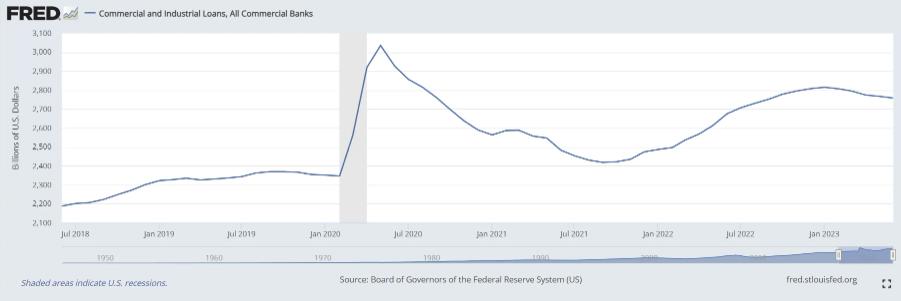
What I want to talk about this afternoon is–Commercial and Industrial Loans, All Commercial Banks.
What are Commercial and Industrial Loans?
Commercial and Industrial (C&I) loans are loans made to businesses or corporations, not to individual consumers. These loans can be used for a variety of purposes, including capital expenditures (like buying equipment) and providing working capital for day-to-day operations. They are typically short-term loans with variable interest rates 1.
C&I loans are a key driver of economic growth because they provide businesses with the funds they need to expand, invest, and hire, which can stimulate economic activity. They are a major line of business for many banking firms as they provide credit for a wide array of business purposes 2.
As interest rates have risen, it has becomes more expensive for banks to borrow money. This increased cost can be passed on to businesses in the form of higher interest rates on commercial and industrial loans. This means that businesses would have to pay more to borrow money, which would make them less likely to take out loans for things like expansion or equipment upgrades–lining up with the recent downturn we can observe:
www.federalreserve.gov/releases/h8/20230728/

Commercial and Industrial Loans hit a recent high in January of 2023. ($2,815 billion)
| Date | Commercial and Industrial Loans, All Commercial Banks ($ billions) | Down from all time high (billions) |
|---|---|---|
| May 2022 | $2,613 | – |
| June 2022 | $2,675 | – |
| July 2022 | $2,707 | – |
| August 2022 | $2,730 | – |
| September 2022 | $2,752 | – |
| October 2022 | $2,778 | – |
| November 2022 | $2,795 | – |
| December 2022 | $2,807 | – |
| January 2023 | $2,815 | 0 |
| February 2023* | $2,807 | -$8 billion |
| March 2023 | $2,795 | -$20 billion |
| April 2023 | $2,774 | -$41 billion |
| May 2023 | $2,767 | -$48 billion |
| June 7, 2023 | $2,752 | -$63 billion |
| June 14, 2023 | $2,765 | -$50 billion |
| June 21, 2023 | $2,762 | -$53 billion |
| June 28, 2023 | $2,754 | -$61 billion |
| July 5, 2023 | $2,755 | -$60 billion |
| July 12, 2023 | $2754 | -$61 billion |
| July 19, 2023 | $2753 | -$62 billion |
If the Economy is so great (2.4% GDP this week remember!), why aren’t banks lending more?
- This two-tiered system – liquidity for banks (even if they aren’t lending like you know, banks are supposed to), rate hikes for everyone else – has set us on a disastrous course as it discourages businesses from borrowing and investing since the banks are getting a ‘better deal’ elsewhere, which slow down economic growth, and exacerbates wealth inequality.
Bank Term Funding Program (BTFP):
fred.stlouisfed.org/series/H41RESPPALDKNWW
Why are the Banks borrowing so heavily? Commercial deposits have been shrinking along with M2–and the money they are making of C&I loans nowhere close to plugging the gap!
fred.stlouisfed.org/series/DPSACBW027SBOG
A tad over a year ago (4/13/2022) the high was hit at $18,158.3536 billion
| Date | Deposits, All Commercial Banks (billions) | Down from all time high (billions) |
|---|---|---|
| 4/13/2022 | $18,158 | 0 |
| 2/22/2023 (Run picks up speed) | $17,690 | -$468 billion |
| 3/1/2023 | $17,662 | -$496 billion |
| 3/8/2023 | $17,599 | -$559 billion |
| 3/15/2023 | $17,428 | -$730 billion |
| 3/22/2023 | $17,256 | -$902 billion |
| 3/29/2023 | $17,192 | -$966 billion |
| 4/5/2023 | $17,253 | -$905 billion |
| 4/12/2023 | $17,168 | -$990 billion |
| 4/19/2023 | $17,180 | -$978 billion |
| 4/26/2023 | $17,164 | -$994 billion |
| 5/3/2023 | $17,149 | -$1,009 billion |
| 5/10/2023 | $17,123 | -$1,035 billion |
| 5/17/2023 | $17,152 | -$1006 billion |
| 5/24/2023 | $17,238 | -$920 billion |
| 5/31/2023 | $17,282 | -$876 billion |
| 6/7/2023 | $17,203 | -$955 billion |
| 6/14/2023 | $17,297 | -$861 billion |
| 6/21/2023 | $17,343 | -$815 billion |
| 6/28/2023 | $17,342 | -$816 billion |
| 7/5/2023 | $17,367 | -$791 billion |
| 7/12/2023 | $17,289 | -$869 billion |
All this money pulled from commercial banks as M2 (U.S. money stock–currency and coins held by the non-bank public, checkable deposits, and travelers’ checks, plus savings deposits, small time deposits under 100k, and shares in retail money market funds) is decreasing:
fred.stlouisfed.org/series/M2SL
A little less than a year ago (July 2022) the M2 high was hit at $21,703 billion
| Date | M2 (billions) | Down from all time high (billions) |
|---|---|---|
| July 2022 | $21,703 | 0 |
| August 2022 | $21,660 | -$43 billion |
| September 2022 | $21,524 | -$179 billion |
| October 2022 | $21,432 | -$271 billion |
| November 2022 | $21,398 | -$305 billion |
| December 2022 | $21,358 | -$345 billion |
| January 2023 | $21,212 | -$491 billion |
| February 2023* | $21,076 | -$627 billion |
| March 2023 | $20,840 | -$863 billion |
| April 2023 | $20,673 | -$1030 billion |
| May 2023 | $20,805 | -$898 billion |
\Bank run in commercial banks picked up in February 2023.)
The Fed has created an emergency backstop program so that banks won’t have to sell assets into the market if customers pull deposits in search of more attractive yields for their savings….

Over the few weeks prior to the FDIC receivership announcements on March 10 and 12, the banking sector lost another approximately $450 billion. Throughout, the banking sector has offset the reduction in deposit funding with an increase in other forms of borrowing which has increased by $800 billion since the start of the tightening.
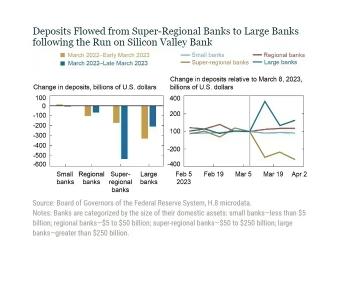
The right panel of the chart below summarizes the cumulative change in deposit funding by bank size category since the start of the tightening cycle through early March 2023 and then through the end of March. Until early March 2023, the decline in deposit funding lined up with bank size, consistent with the concentration of deposits in larger banks. Small banks lost no deposit funding prior to the events of late March. In terms of percentage decline, the outflows were roughly equal for regional, super-regional, and large banks at around 4 percent of total deposit funding:

The blue bar in the left panel above shows that the pattern changes following the run on SVB. The additional outflow is entirely concentrated in the segment of super-regional banks. In fact, most other size categories experience deposit inflows.
The right panel illustrates that outflows at super-regionals begin immediately after the failure of SVB and are mirrored by deposit inflows at large banks in the second week of March 2022.
Further, while deposit funding remains at a lower level throughout March for super-regional banks, the initially large inflows mostly reverse by the end of March. Notably, banks with less than $100 billion in assets were relatively unaffected.

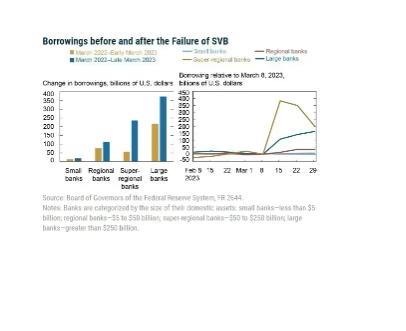
- Large banks increased borrowing the most, which is in line with deposit outflows being strongest for larger banks before March 2023.
- During March 2023, both super-regional and large banks increase their borrowings, with most increases being centered in the super-regional banks that faced the largest deposit outflows.
- Note, however, that not all size categories face deposit outflows but that all except the small banks increase their other borrowings.
- This pattern suggests demand for precautionary liquidity buffers across the banking system, not just among the most affected institutions:

Wut Mean?
- Banks have been replacing deposit outflows with the borrowing we have covered above.
- ‘Strong and resilient’ indeed….
- It is starting to smell idiosyncratic all up in here:
www.marketwatch.com/story/u-s-bank-lending-falls-in-latest-week-fed-says-b633e731
TLDRS:
- Commercial and Industrial Loans slide for the second week in a row.
- Commercial and industrial lending has fallen for four months in a row, yet GDP up 2.4% for the last quarter? Sounds like a ton of DEBT fueling all this ‘growth’!…
- Commercial and Industrial (C&I) loans are loans given to businesses, not individuals.
- They’re used for things like buying equipment or providing working capital for day-to-day operations.
- These loans are crucial for economic growth because they give businesses the funds they need to expand, invest, and hire, which can stimulate economic activity, which we saw grow at 2.4% last quarter.
- But here’s the thing: C&I loans hit a high in January 2023 at $2,815 billion. Since then, they’ve been on a bit of a slide. Now, they were down to $2,753 billion – that’s a drop of $62 billion from the peak.
- I believe this is in par because the Fed has created an emergency backstop in BTFP so that banks won’t have to sell assets into the market if customers pull deposits in search of more attractive yields for their savings.
- The Bank Term Funding Program (BTFP) is essentially putting a finger on the scale of the free market.
- While it’s designed to provide liquidity to banks during times of stress, it is distorting market operations.
- Banks can borrow at a fixed rate through the BTFP, effectively shielding them from rising interest rates.
- Meanwhile, businesses and consumers face higher borrowing costs as the Fed raises rates.
- This two-tiered system – liquidity for banks (even if they aren’t lending like you know, banks are supposed to), rate hikes for everyone else – has set us on a disastrous course as it discourages businesses from borrowing and investing since the banks are getting a ‘better deal’ elsewhere, which slow down economic growth, and exacerbates wealth inequality.
- Could bank lending be down because of the updated guidance have to do with the FDIC noticing that some banks aren’t correctly reporting the amount of deposits they have that aren’t covered by federal insurance?
- Some banks mistakenly think that if a deposit is backed by assets (like collateral), it doesn’t need to be reported as uninsured.
- This isn’t right! The deposit’s status doesn’t change just because it has collateral.
- When banks incorrectly report uninsured deposits, it could create a perception in the market that these banks are more stable than they actually are.
- Banks that incorrectly report uninsured deposits might face liquidity challenges in extreme circumstances, where depositors simultaneously demand their funds.
- Reminder, while banks have the liquidity fairy, ‘we’ get the promise of 2 more rate hikes this year, Atlanta Fed President Raphael Bostic yet again enrichens himself inappropriately from his position.
- To fix one end of their mandate (price stability) from the inflation problem they created, the Fed will continue sacrificing employment (the other end of their mandate) to bolster price stability by continuing to raise interest rates–causing further stress to businesses and households.
- I believe inflation is the match that has been lit that will light the fuse of our rocket.
Views: 48