by LamboSkillz

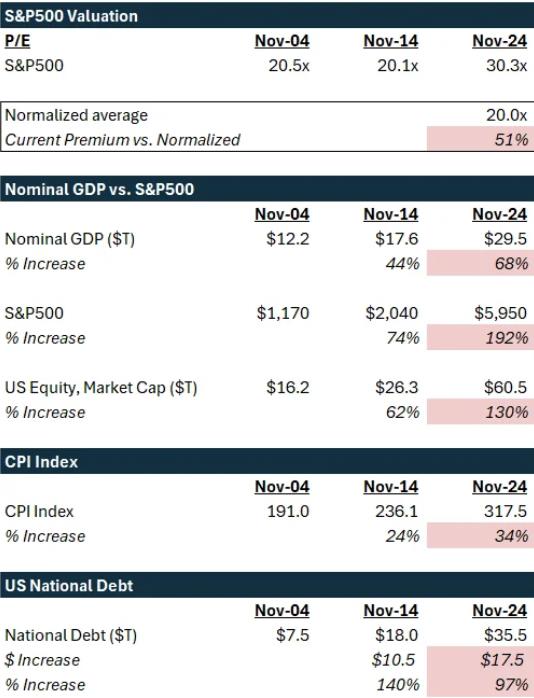
I think the markets are frothy, and we have been going through mini-cycles which raise and lower sentiment almost on a weekly basis, drifting further and further away from fundamentals. Earnings releases, tax cuts (elections), lower rates, etc. – there are endless catalysts. The stock market has become a casino. In my opinion, this all started during COVID with the influx of retail investors (and the boom of this sub) and while we’ve gone through a “recession” and down-markets, the excitement around the stock market is at an all-time high, as are valuations. I’ve mapped out the last 20 years and have taken a very simple approach. I know there are a ton more considerations, so please note any large ones I may be missing. Below is a table I put together in excel, and some explanation on each factor mentioned – when you step back, it looks like we’re due for a major reset on valuations.
TLDR (Takeaways from the table):
S&P500 Valuation. Even though I don’t like P/E ratios (in favor of EV/EBITDA), I’ll use it as most folks here are more familiar with it. P/E ratios have been around ~20x, and we are currently sitting at 30x. Looking back even further, they used to hover around the 10-20x P/E range. Yes, all companies are growing, so the S&P500 should too. But the growth in valuations is outpacing economic growth (see below). Larger and faster-growing companies deserve higher valuations, so this can be part of the reason, but current levels seem to be a stretch, especially if you compare it to actual GDP growth.
GDP Growth. This is one I’ve been focused on lately. Nominal GDP in the US has gone up 2.4x over the last 20 years, yet the S&P500 has gone up 5.1x (total stock market went up 3.7x). Nuances: (1) international revenue of American companies is not in GDP, however the % of foreign revenue in the S&P has remained steady over the last 10-20 years. (2) this doesn’t factor in private companies, IPO trends, de-listings, etc. Nominal GDP compares well to S&P500 as both are unadjusted for inflation.
CPI Index. “Inflation has come down, yay!” The rate has come down. Many folks expected deflation after 2022, to restore prices, however that never happened. We’re at higher prices than 2022. Inflation has picked up 34% over the last 10 years, vs. 24% in the preceding 10 years. Maybe this is the new norm, but it’s all factoring into the revenues the S&P companies are generating, and thereby, the valuations.
National Debt. I’m not an expert at this category, but we’re adding on more national debt at a record pace as well. Most PPP loans were forgiven, credit is cheap (again), so if we keep adding here, when does the circus stop?
Edit: I updated real GDP to nominal GDP below to reflect a more accurate comparison, but the punchline still stands – the S&P has far outpaced it, especially comparing the last decade to the decade before.
Views: 200