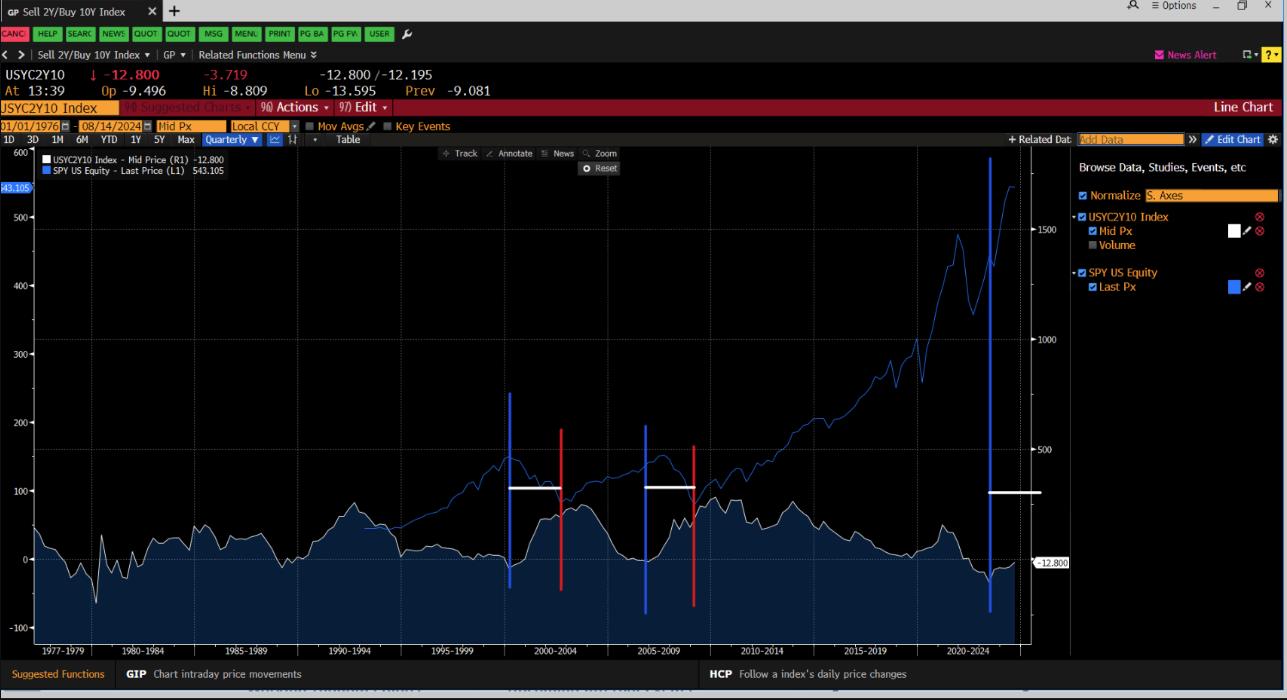
Blue line marks 2Y10Y yield curve inversion bottom. Red line marks SPY correction bottom. White bar is constant period in between.

The Labor market is telling us something. 👇🏼
Who’s listening? pic.twitter.com/oM1Gt8KUjL
— Kalani o Māui (@MauiBoyMacro) August 14, 2024
h/t mrmrmrj
Views: 165