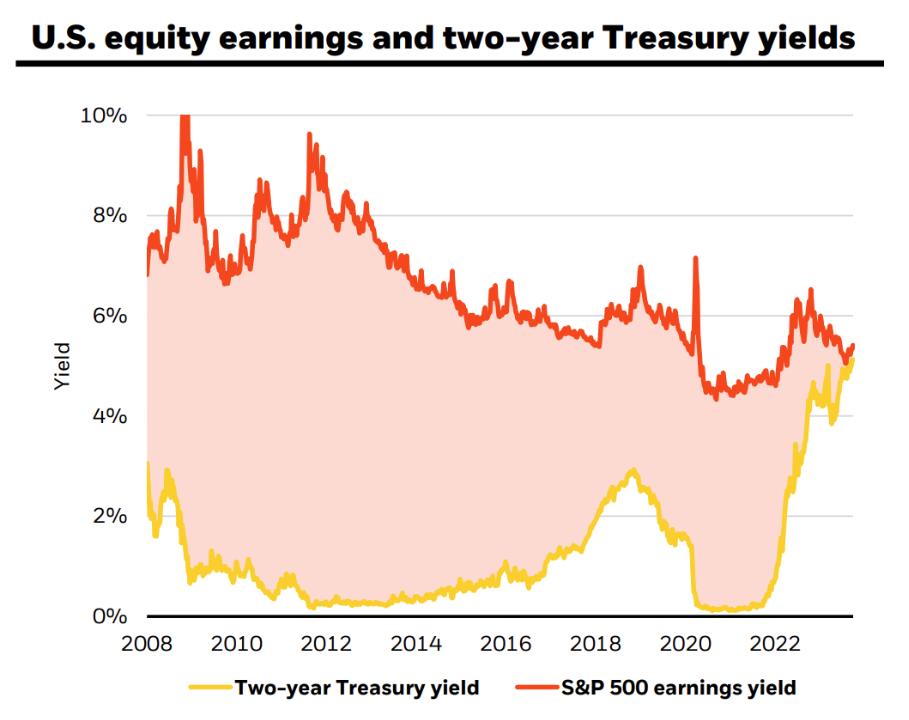
Source: BlackRock 2023 global outlook Q4 update https://www.blackrock.com/us/individual/literature/whitepaper/bii-global-outlook-in-charts.pdf
The S&P 500 earnings yield is a measure of how much income investors are receiving per dollar invested in the stock market. It is calculated by dividing the total earnings of the companies in the index by the price of the index. As you can see from the chart, since 2008, there has been an inverse relationship between equity earnings and two-year Treasury yields. When one goes up, the other goes down. This makes sense because when bond yields are high, it means that interest rates are also high and this makes stocks less attractive to investors who can get a better return on their investment elsewhere. However, lately we have seen treasury yields start to rise while equity prices continue to go up (the red line is going up while orange line is going down). This could mean that either inflationary pressures are starting to build or that investor confidence in stocks is waning and they are beginning to rotate out of equities into bonds.
h/t FaatmanSlim